Pathway and Network Analysis of Omics Data Lab 2
This work is licensed under a Creative Commons Attribution-ShareAlike 3.0 Unported License. This means that you are able to copy, share and modify the work, as long as the result is distributed under the same license.
Over-representation analysis (ORA) practical lab: g:Profiler
Introduction
The practical lab contains one exercise. This exercise uses g:Profiler to perform gene-set enrichment analysis.
Goal of the exercise
Learn how to run g:Profiler and explore the results.
Data
The data used in this exercise is gene expression (transcriptomics) obtained from high-throughput RNA sequencing. They correspond to Ovarian serous cystadenocarcinoma samples. This cohort was previously stratified into four distinct expression subtypes PMID:21720365 and a subset of the immunoreactive and mesenchymal subtypes are compared to demonstrate the workflow.
How was the data processed?
Gene expression from the TCGA Ovarian serous cystadenocarcinoma RNASeq V2 cohort was downloaded on 2015-05-22 from cBioPortal for Cancer Genomics. Differential expression for all genes between the mesenchymal and immunoreactive groups was estimated using edgeR. Two gene lists were created by selecting that genes that were differentially expressed in the mesenchymal sugroup when compared to the immunoreactive subgroup (FDR<0.001). The R code used to generate the data is included at the bottom of the document in the Additional information section (below the GSEA section).
Exercise
For this exercise, our goal is to copy and paste the list of genes into g:Profiler, adjust some parameters (e.g selecting the pathway databases), run the query and explore the results.
g:Profiler performs a gene-set enrichment analysis using a hypergeometric test (Fisher’s exact test) with the option to consider the ranking of the genes in the calculation of the enrichment significance (minimum hypergeometric test). The Gene Ontology Biological Process and Reactome are going to be selected as pathway databases. The results are displayed as a table or as a hierarchical tree or downloadable as an EnrichmentMap type output.
Before starting this exercise, download the required file mesenvsimmuno_mesenonly_RNAseq_gprofiler.txt.
Start the exercise:
Step 1
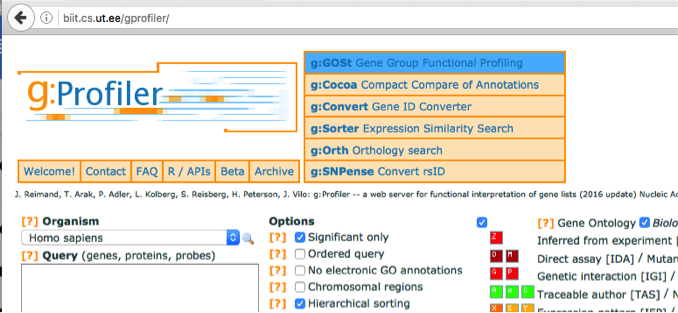
Launch g:Profiler.
1a. Open g:Profiler in your web browser.
Step 2
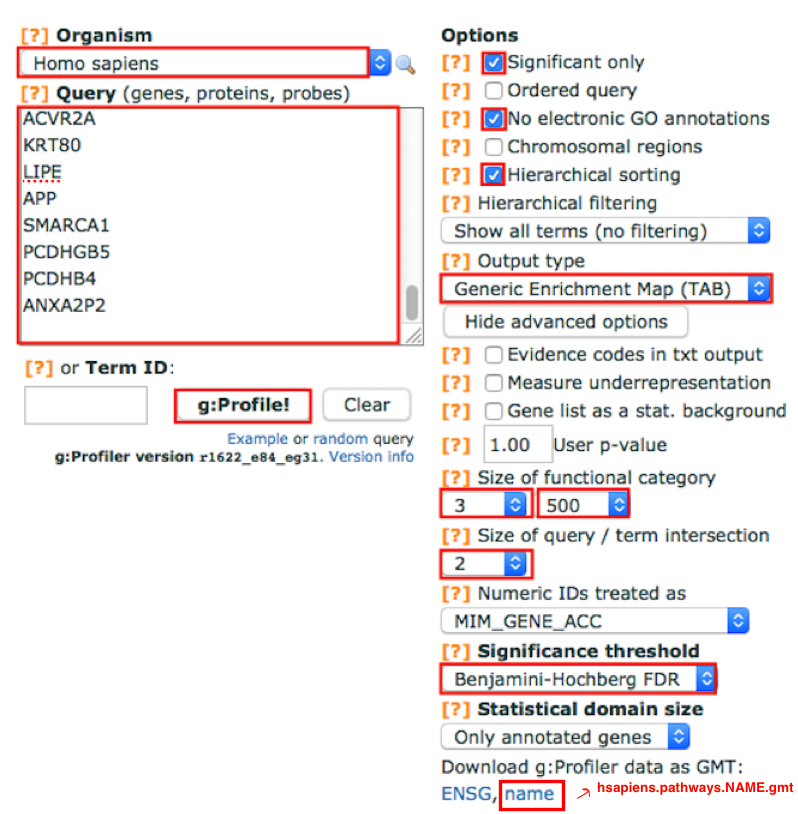
Ensure that Organism is set to Homo sapiens.
Step 3
In the Query box, copy and paste the genes listed in the file mesenvsimmuno_mesenonly_RNAseq_gprofiler.txt.
Tip: open the file in a simple text editor such as Notepad or Textedit to copy the list of genes.
Step 4
Adjust parameters.
4a. Select the following Options by checking the corresponding boxes:
- Significant only - select options if you want g:Profiler to return only pathways that are significant (FDR < 0.05).
TIP: if g:Profiler does not return any results uncheck the significant only option to check that g:Profiler is running successfully but there are simply no significant results for your query
-
No electronic GO annotations - select option if you want to exclude annotations that have been inferred through computations methods. TIP: if g:Profiler does not return any results uncheck the No electronic GO annotation option to expand annotations used in the test.
-
Hierarchical sorting - related enriched gene-sets will be grouped together on same branches of the tree if this option is set (this option is automatically disabled is the number of returned enriched gene-sets is too high).
Set the Output type to Generic Enrichment Map (TAB).
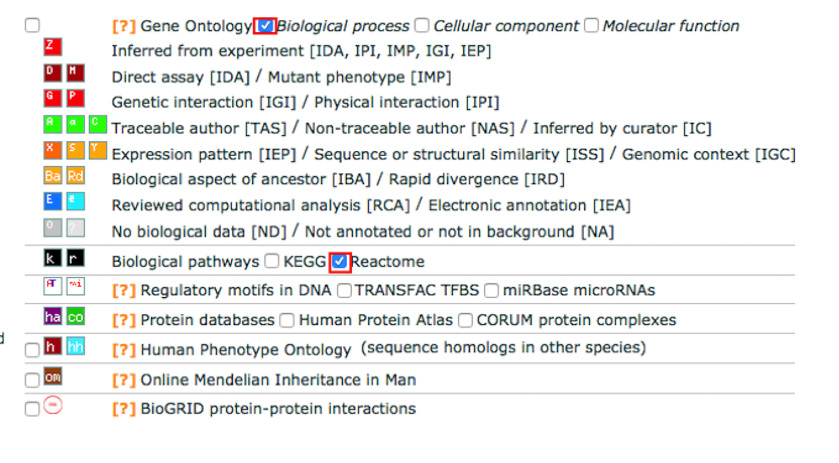
4b. Select the following gene-set databases located at the right side of the ‘Options’ panels by checking the corresponding boxes.
Gene Ontology: Biological Process
Biological pathways: Reactome
Deselect all the other gene-set boxes.
4c. Click on Show advanced options button
Size of functional category: change lower limit to 3 and upper limit to 500
Size of Q&T: Set to 2
Significance threshold: set to Benjamini-HochBerg FDR
Options
Gene-sets
Step 5
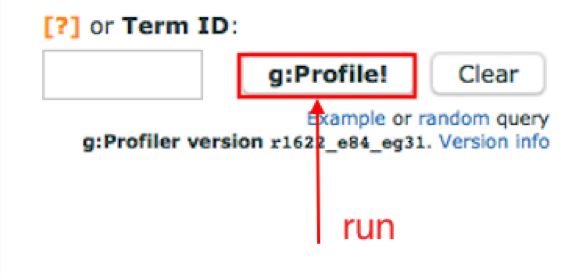
Run g:Profiler.
5a. Click on the g:Profile! button to run g:Profiler.
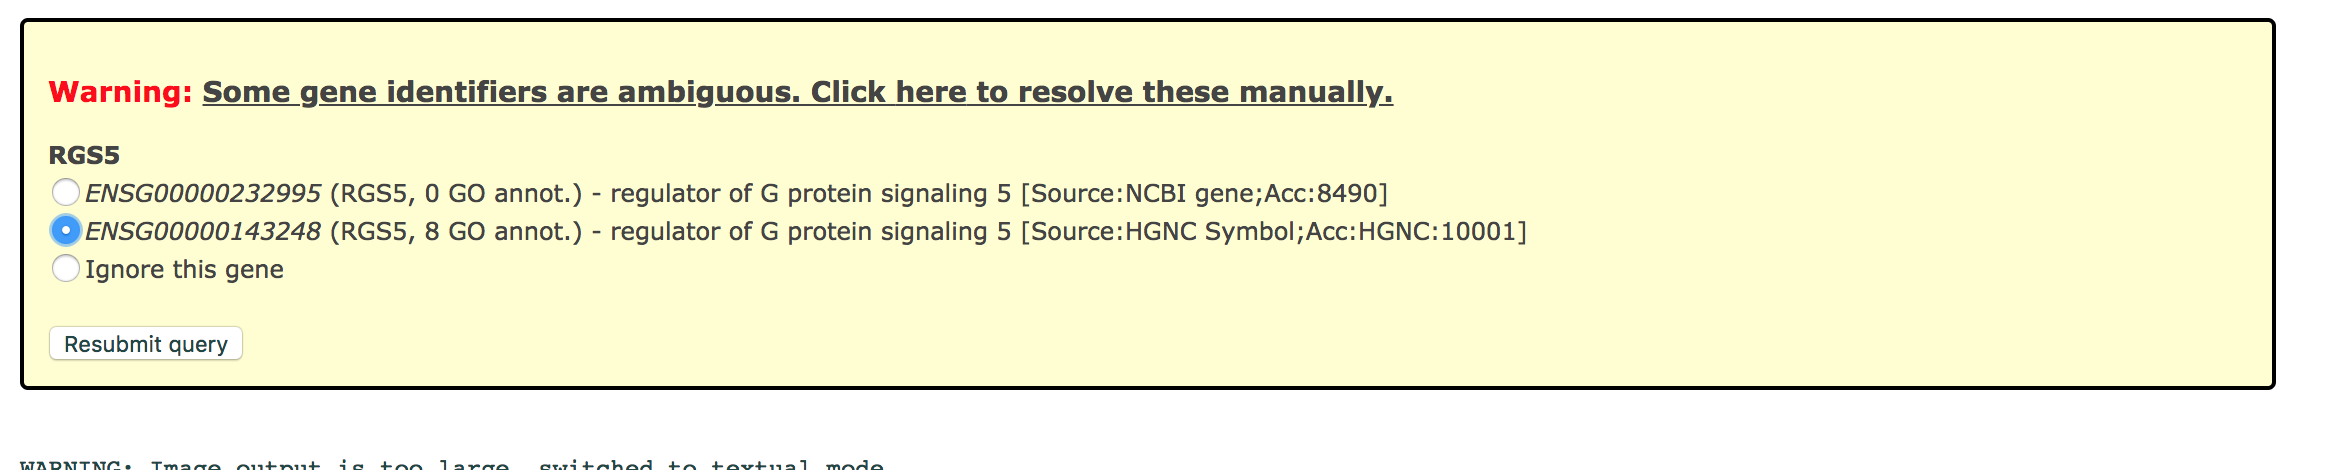
TIP: If after clicking on g:Profiler button the analysis completes but there is the following message above results file - Warning: Some gene identifiers are ambiguous. Resolve these manually?. Click on the link to see which genes names were not resolved. For each ambiguous gene select its correct mapping. Ambiguous mapping is often caused by multiple ensembl ids for a given gene and are easy to resolve as a user. Resubmit query.
Step 6
Download results file
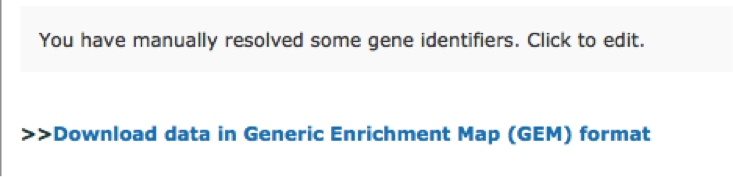
Once g:Profiler finishes to run, a link to the results appears at the bottom of the page: Download data in Generic Enrichment Map (GEM) format.
6a. Right click on this link and save the file on your computer.
6b. Optional but recommended: Right click on the ‘name’ link to save the hsapiens.pathways.NAME.gmt folderon your computer. This is a zipped folder containing several files. The file ‘hsapiens.pathways.NAME.gmt’ is the one that we will use when we create an enrichment map in module 3 as optional step.
Step 7
Explore the results.
7a. Open the file using Microsoft Office Excel or in an equivalent software.
7b. Sort the results using the FDR column and from smallest to largest values.
Observe the results included in this file:
Name of each gene-set
Significance of the overlap
Genes included in each gene-set
Question: Which term has the best corrected p-value? Which genes in our list are included in this term? Observe that same genes can be present in several lines (pathways are related when they contain a lof of genes in common).
Note: the p-value and FDR columns contain identical values because g:Profiler directly outputs the FDR (= corrected p-value) meaning the the p-value column is already the FDR. Phenotype 1 means that each pathway will be represented by red nodes on the Enrichment Map.
Tip: we have downloaded the Generic Enrichment Map format because our goal is to create an Enrichment Map out of the g:Profiler results. If your aim is to have a quick look at the functions enriched in your gene list, you can use the default Graphical (PNG) output type.
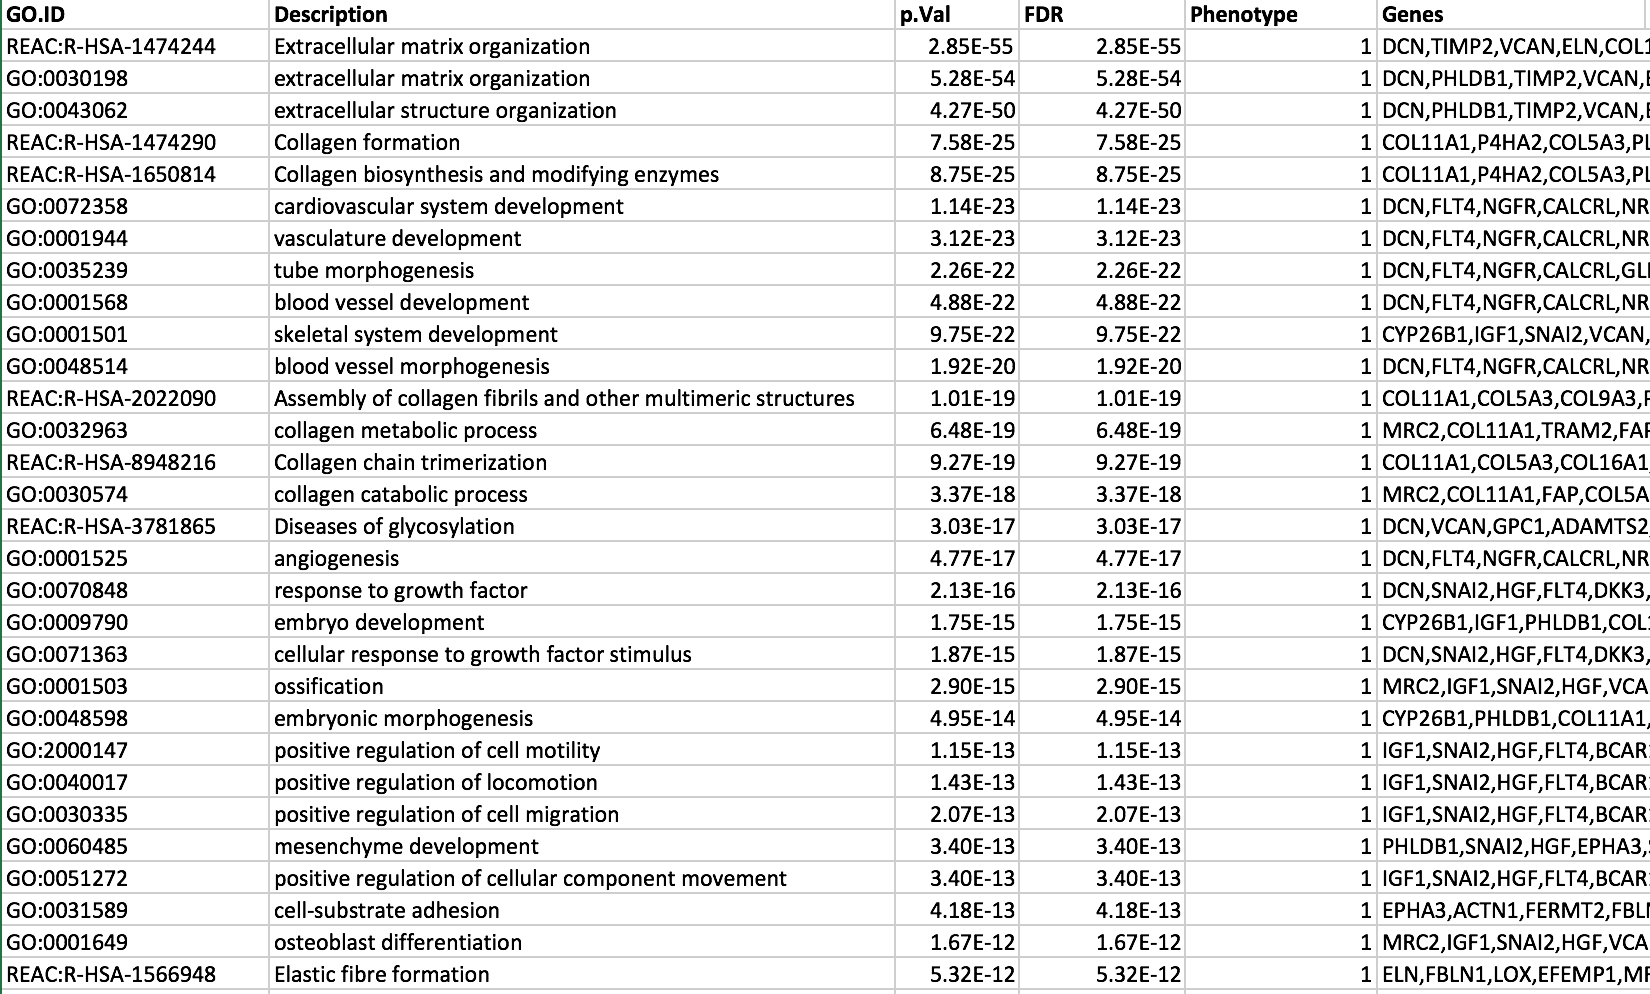
The term extracellular matrix organization is the most significant gene-set (=the lowest FDR value). Many gene-sets from the top of this list are related to each other and have genes in common.
Step 8
Optional:
Option1: If time permits, play with input parameters, e.g. add TRANSFAC TFBS and miRBase microRNAs databases, rerun the query by clicking on the g:Profile! button and explore the new results.
Option2: Re-run the g:Profiler using the “ordered” query checked. This will run the minimum hypergeometric test. When this option is checked, it assumes that the genes were preordered by significance with the most significant gene at the top of the list. Compare the results between “ordered” and non ordered query.
Option3: Re-run g:Profiler and select Bonferonni as method to correct for multiple hypothesis testing and set the output to png. Do you get any significant results?
TIP:Instead of using the g:Profiler website g:profiler can be run directly from R using the gProfilerR package. (See supplemental protocol at Protocol 1 - gProfiler from R for more details.
Additional information
More on processing the RNAseq using EdgeR and generate the .rank file