Pathway and Network Analysis of Omics Data Lab 3
This work is licensed under a Creative Commons Attribution-ShareAlike 3.0 Unported License. This means that you are able to copy, share and modify the work, as long as the result is distributed under the same license.
Network Visualization and Analysis with Cytoscape: Enrichment Map from g:Profiler results
By Veronique Voisin
Goal of the exercise:
Create an EnrichmentMap and navigate through the network
During this exercise, you will learn how to create an EnrichmentMap from gene-set enrichment results. The enrichment tool chosen for this exercise is g:Profiler but an enrichment map can be created from various gene-set tools using the generic format or the more specific GSEA or BinGO interface.
Data
The data used in this exercise is gene expression data obtained from high throughput RNA sequencing used in Module2 . They correspond to Ovarian serous cystadenocarcinoma samples. We use precomputed results of the g:Profiler analysis performed in module 2 to create an Enrichment Map with the aim to transform the tabular format in a network to better visualize the relationships between the significant gene-sets.
EnrichmentMap
-
A red circle (node) is a pathway specific of the mesenchymal type.
-
Green edges
represent genes in common between 2 pathways (nodes).
-
A cluster of nodes represent overlapping and related pathways and may represent a common biological process.
- Clicking on a node will display the genes included in each pathway.
Start the exercise
To start the lab practical section, first create a gprofiler_files directoty on your computer and download it the files below.
Four files are needed to create the enrichment map for this exercise (please download these files on your computer):
Expression: MesenchymalvsImmunoreactive_RNAseq_expression.txt
Enrichments: gprofiler_results_mesenchymal.txt
Ranks: MesenchymalvsImmunoreactive_RNAseq_ranks.rnk
Classes: MesenchymalvsImmunoreactive_RNAseq_classes.cls
Pathway database (.gmt):hsapiens.pathways.NAME.gmt.zip
Optional: you could use the g:Profiler result file and the .gmt file you have saved from module 2 but you may get slightly different results as the g:Profiler database has been updated since the creation of these files.
Step 1
Launch Cytoscape and open Enrichment Map App
1a. Double click on Cytoscape icon
1b. Open Enrichment Map App
-
In the Cytoscape top menu bar:
-
Click on Apps -> Enrichment Map

- A ‘Create Enrichment Map’ window is now opened.
Step 2
Create an enrichment map
2a. In the ‘Create Enrichment Map window’ , click on the ‘+” plus sign to create a new data set.
2b. Specify the following parameters:
-
Name: use default or choose a name of your choice like ‘g:Profiler network’
-
Analysis Type: Generic/gProfiler
-
Enrichments: gprofiler_results_mesenchymal.txt TIP: only field that is not optional
-
GMT : hsapiens.pathways.NAME.gmt.zip
-
Ranks - MesenchymalvsImmunoreactive_RNAseq_ranks.rnk TIP: This field is optional but recommended
-
Expressions - MesenchymalvsImmunoreactive_RNSseq_expression.txt TIP: This field is optional but recommended
-
Classes - MesenchymalvsImmunoreactive_RNAseq_classes.cls TIP: This field is optional.
-
Phenotype - In the text boxes type Mesenchymal in the “Positive” field. Mesenchymal will be associated with red nodes because it corresponds to the phenotype in the g:Profiler result (gene list)
-
Set FDR q-value cutoff to 0.0001 TIP: to set threshold to very small numbers select Scientific Notation and set Q-value cut off to 1E-04

2c. Click on Build button at the bottom of the Enrichment Map Input panel.
Unformatted results
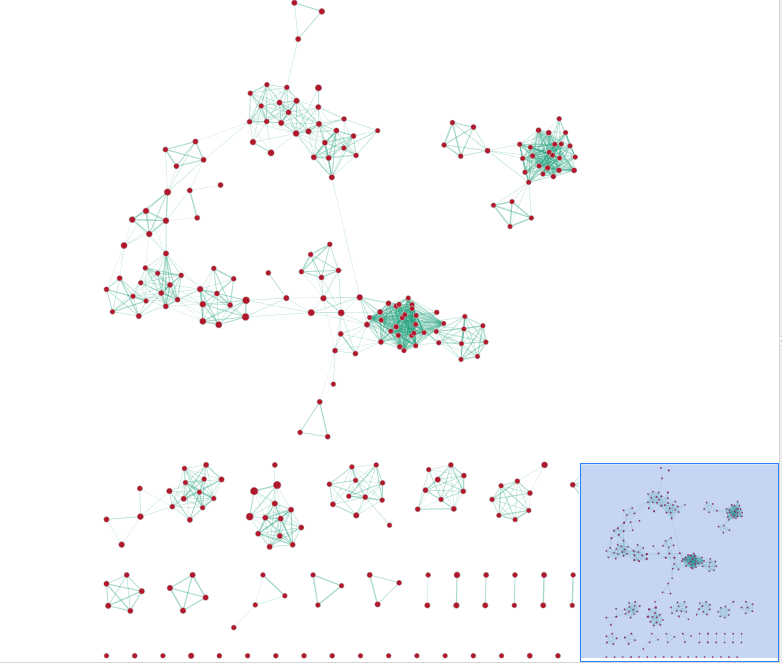
- In the Cytoscape menu bar, select ‘View” and ‘Show Graphic Details’ to display node labels. Zoom in to be able to read the labels and navigate the network using the bird eye view.
Step 3
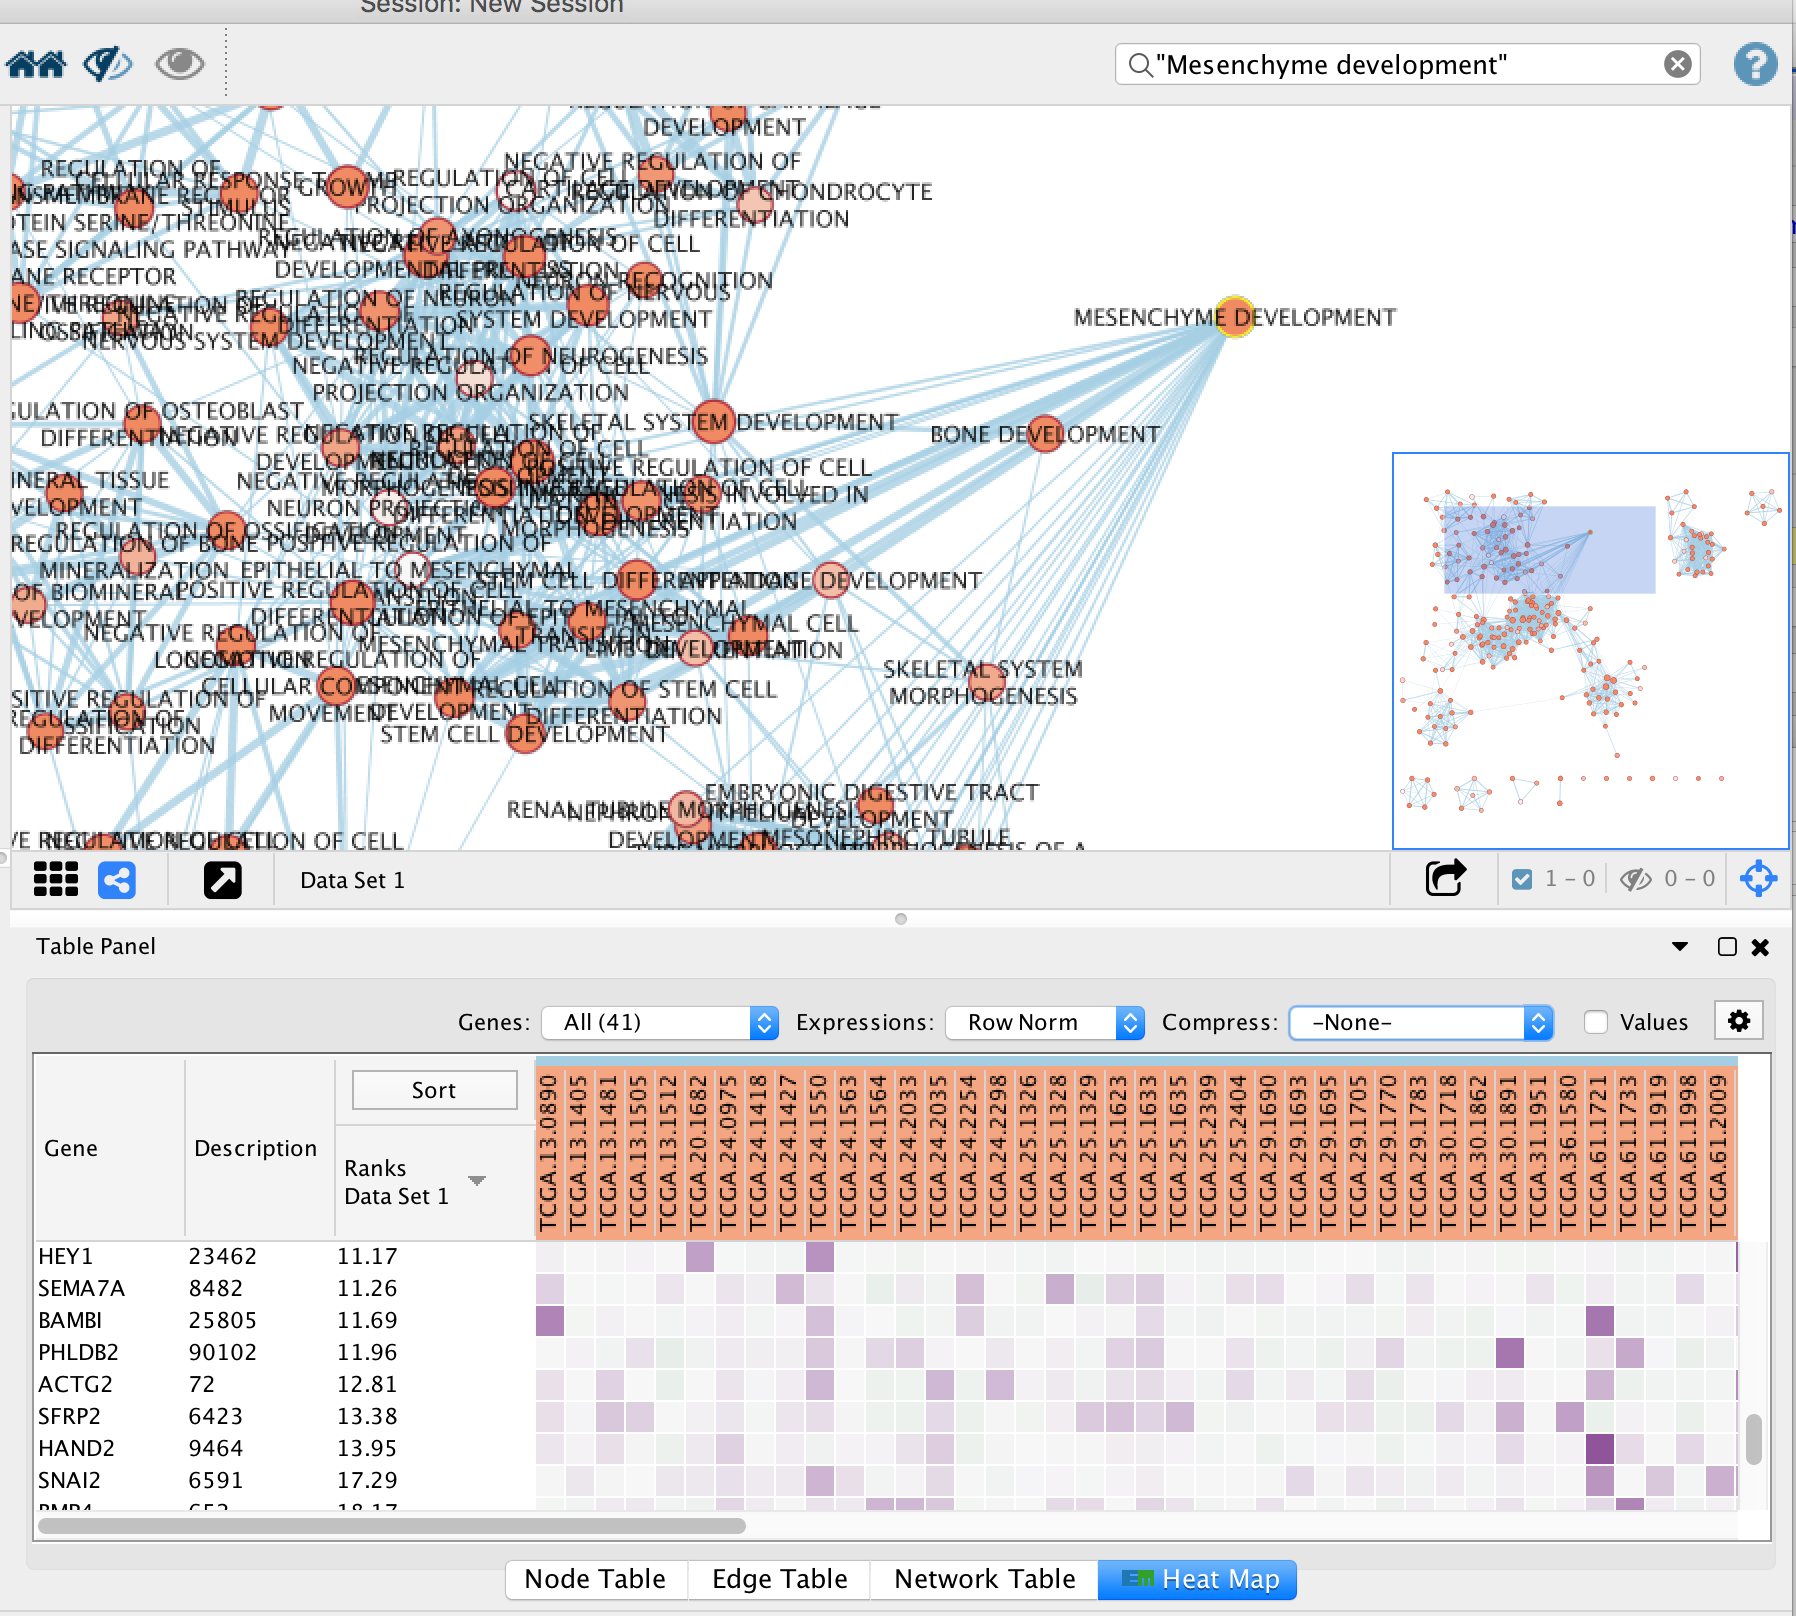
Select a node and visualize the Table Panel
3a. Click on a node
For this example the node “MESENCHYME DEVELOPMENT” has been selected. Tip: you can type it in the search bar, quotes are important.
When the node is selected, it is highlighted in yellow.
3b. In Table Panel:
-
Click on the Sort Column on “Ranks Data Set1”
-
Set Expressions to Row Norm
-
Set Compress to -None- (tip: select the field and use the keyboard arrows up to select it)
You can now visualize the genes in the MESENCHYME DEVELOPMENT pathway that are higher expressed in the mesenchymal samples when compared to the immunoreactive samples.
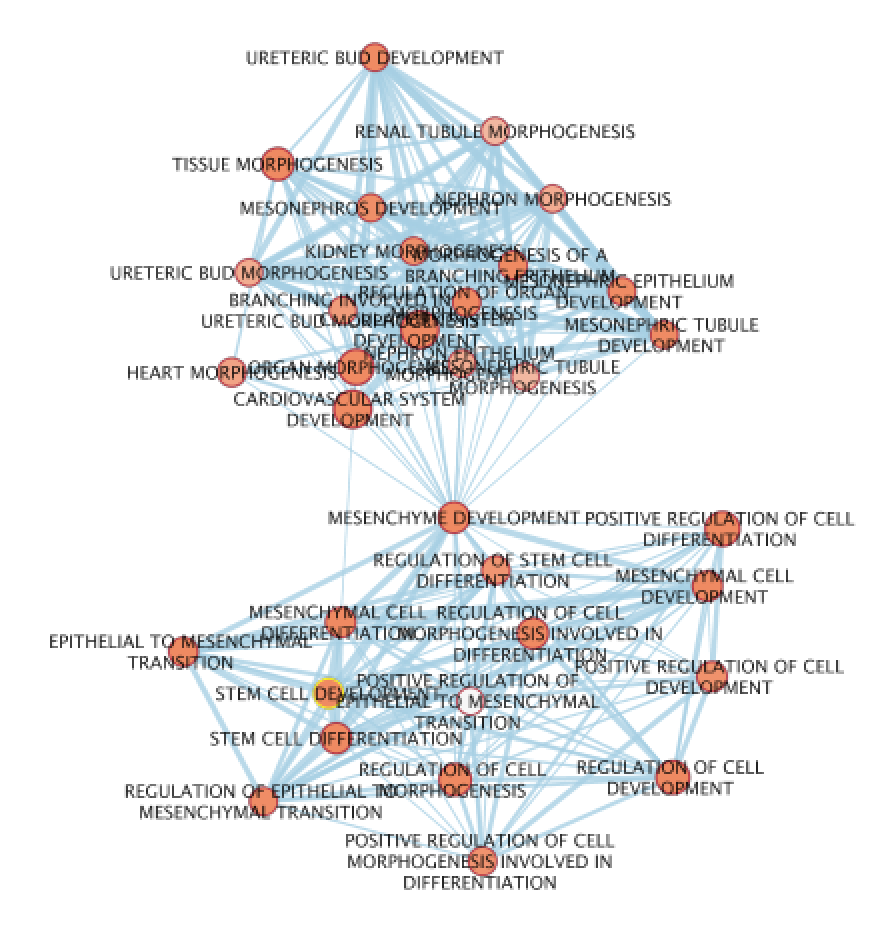
OPTIONAL
- Create a subnetwork : select nodes connected to the “MESENCHYME DEVELOPMENT” node by looking at the Cytoscape toolbar and selecting the correct icon (2 houses). Once the nodes that are connected to “MESENCHYME DEVELOPMENT” are highlghted in yellow, create a subnetwork by selecting the appropriate icon on the left side on the previous icon. Redo the layout and manually move the nodes so the labels are not overlapping.

- Use the AutoAnnotate App to create annotated clusters. Use the instructions from the GSEA lab.