High-throughput Biology - From Sequence to Networks 2019 - Lab 15 - Part 3
This work is licensed under a Creative Commons Attribution-ShareAlike 3.0 Unported License. This means that you are able to copy, share and modify the work, as long as the result is distributed under the same license.
Module 15 Practical Lab: Create a custom network using Cytoscape
Veronique Voisin
Goal of this practical lab
The goal of this exercise is to learn how to create a custom network in Cytoscape. In this example, the proteins are the entities that we would like to represent in the network and known physical interactions are the connections between the proteins that we will represent as edges. We will overlay 2 additional information about these proteins, mutation information per protein as node color and mutation expression as node size.
This practical consists of 1 exercise. You can choose to do these exercises using the questions as your only guide (section ‘QUESTIONS AND STEPS TO FOLLOW) - or see the following pages for the step-by-step checklist to finding the answers (section ‘ANSWERS: DETAILED STEPS AND SCREENSHOTS’).
Before starting the exercises,download the files:
NOTE: Network layouts are flexible and can be rearranged. What you see when you perform these exercises may not be identical to what you see in the tutorial, or what you have seen other times that you have performed the exercises.
QUESTIONS AND STEPS TO FOLLOW
Skills: import a network table; import a node table, adjust node color, adjust node size.
STEPS
-
Open Cytoscape.
-
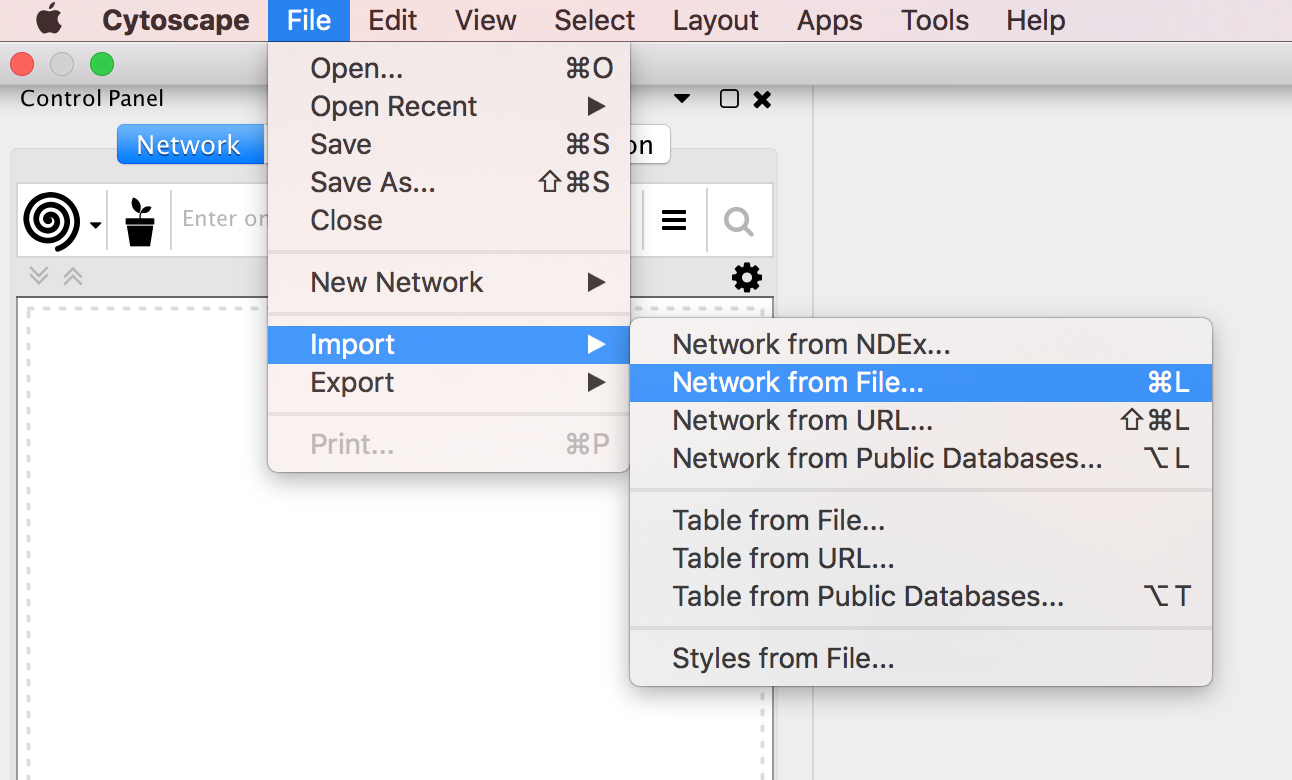
Locate the top menu bar and select ‘File’, ‘Import’, ‘Network from File…’. Browse your computer and select the file network_table.txt and click “Open”.
-
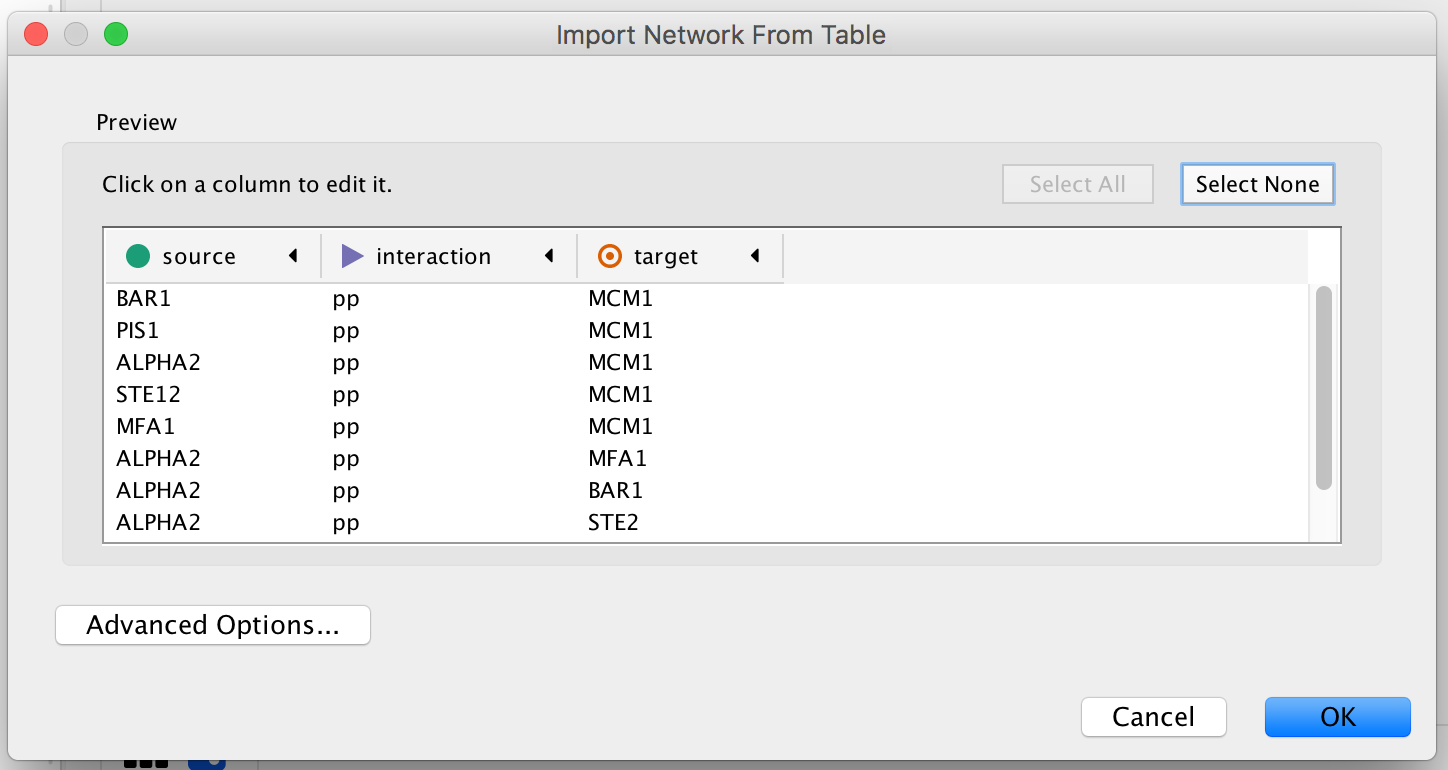
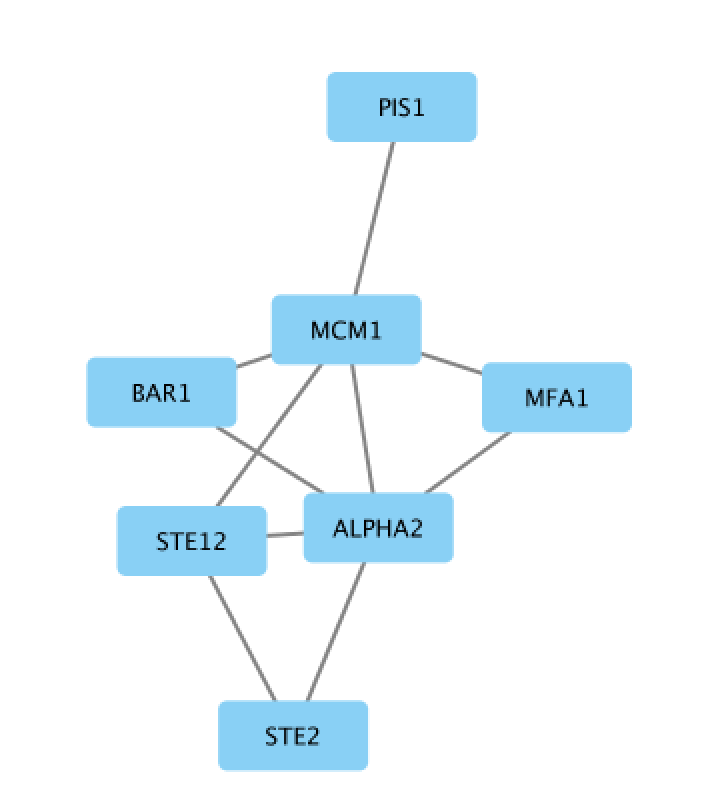
An “Import Network from Table” dialog box opens. The 3 columns of the table should be set as “source”, “interaction” and “target” respectively. Click on “OK”. A network containing the proteins as blue nodes and sharing interaction as edges should be now displayed in Cytoscape main window.
-
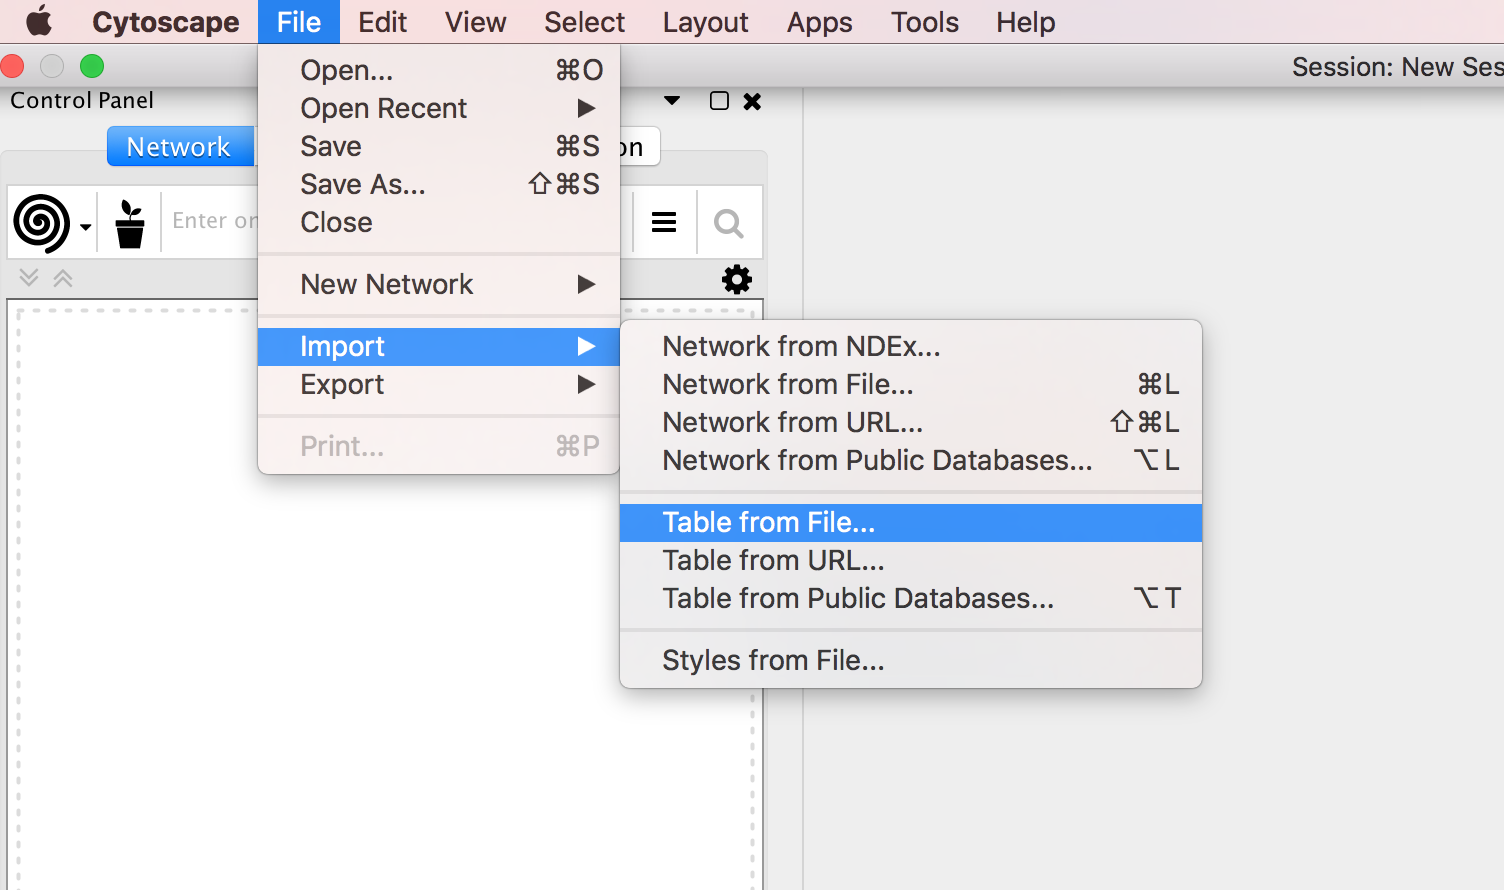
Locate the top menu bar and select ‘File’, ‘Import’, ‘Table from File…’. Browse your computer and select the file node_attributes.txt and click “Open”.
-
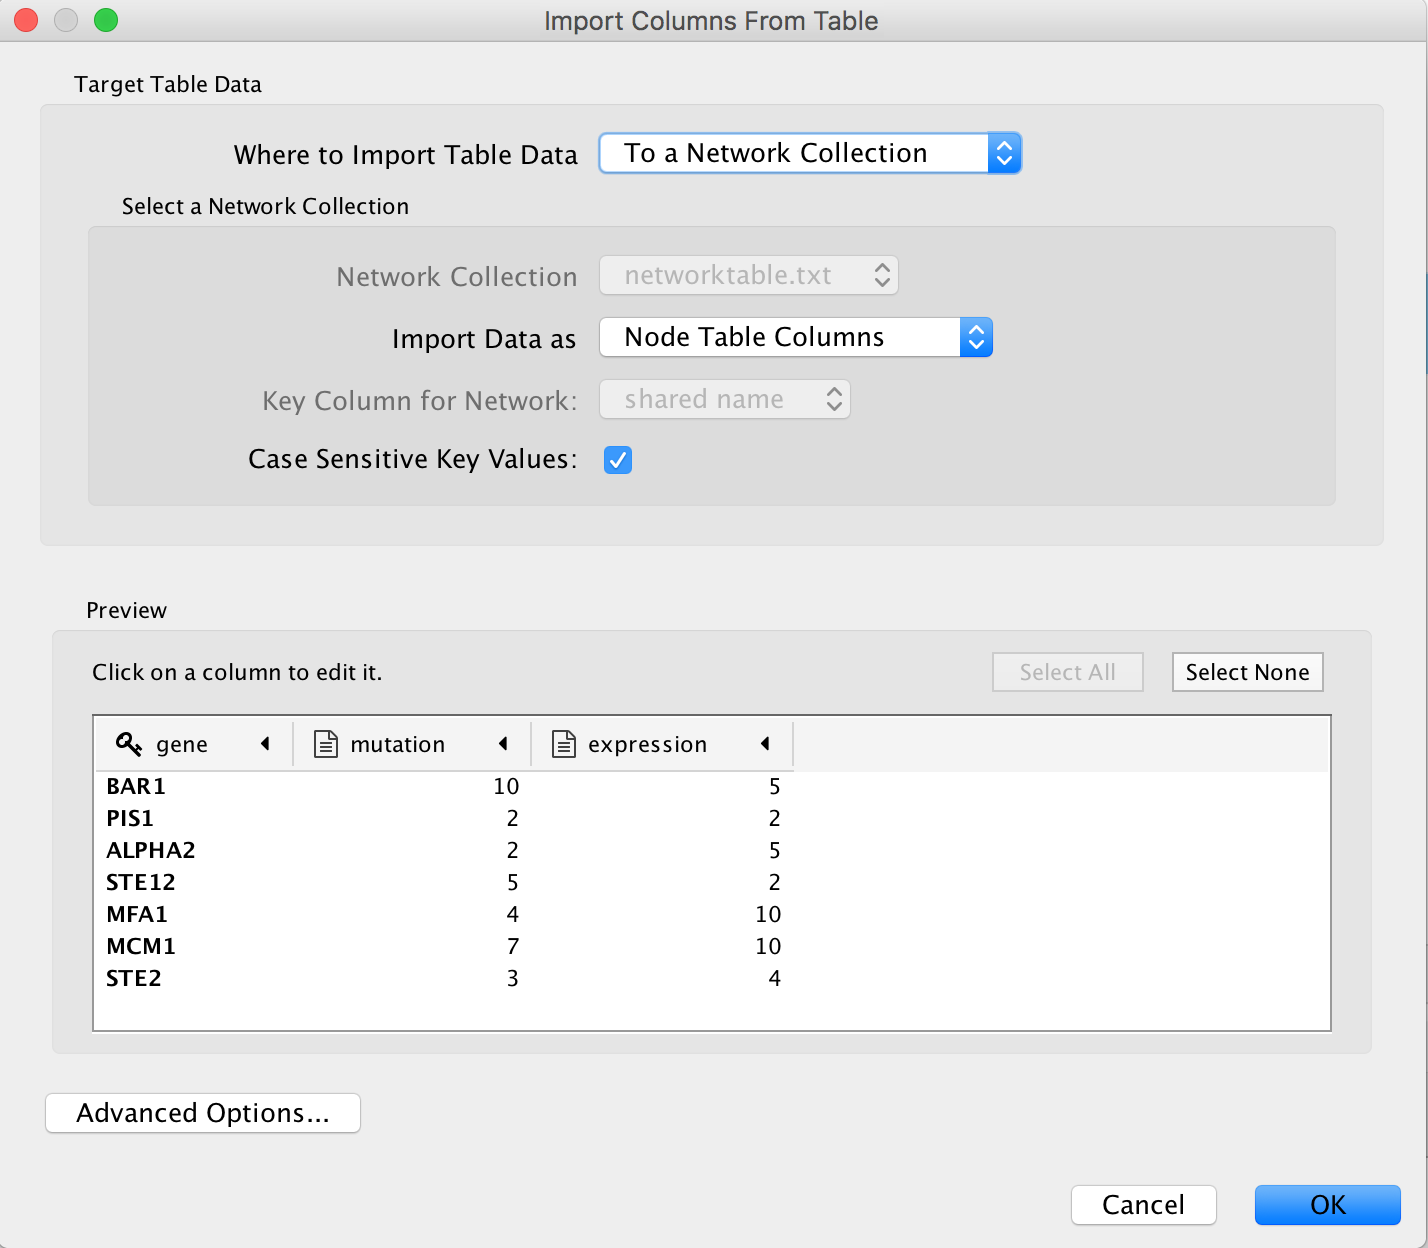
An “Import from Columns” dialog appears. Click on “OK”.
-
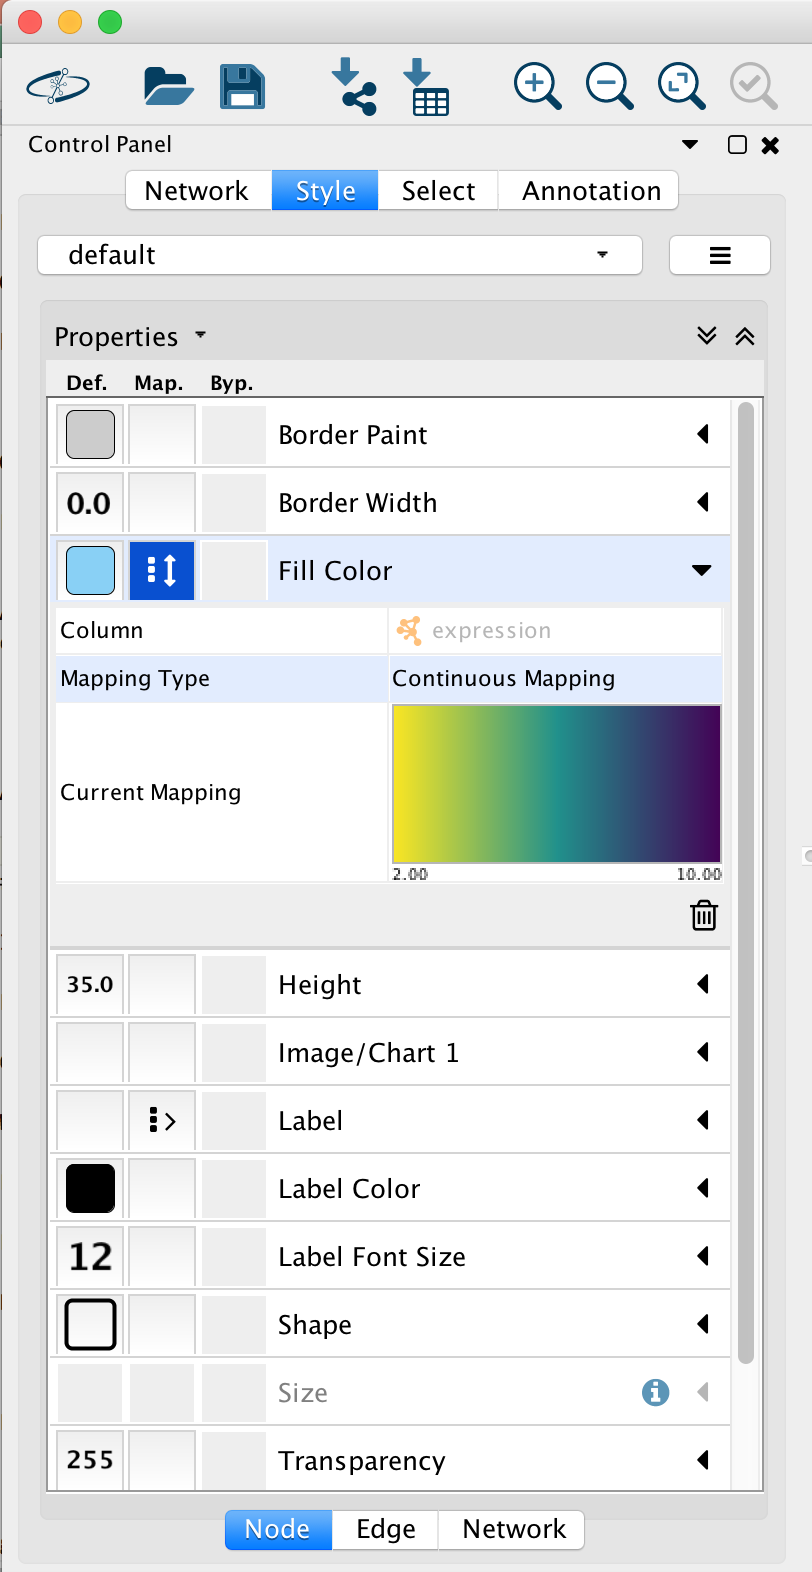
Go to “Control Panel” on the left side and select the “Style” tab. Make sure that you are in the “Node” tab.
-
Select the “Fill Color” field and expand it by clicking on the right arrow. Set “Column” to “expression” and “Mapping Type” to “Continuous Mapping”.
-
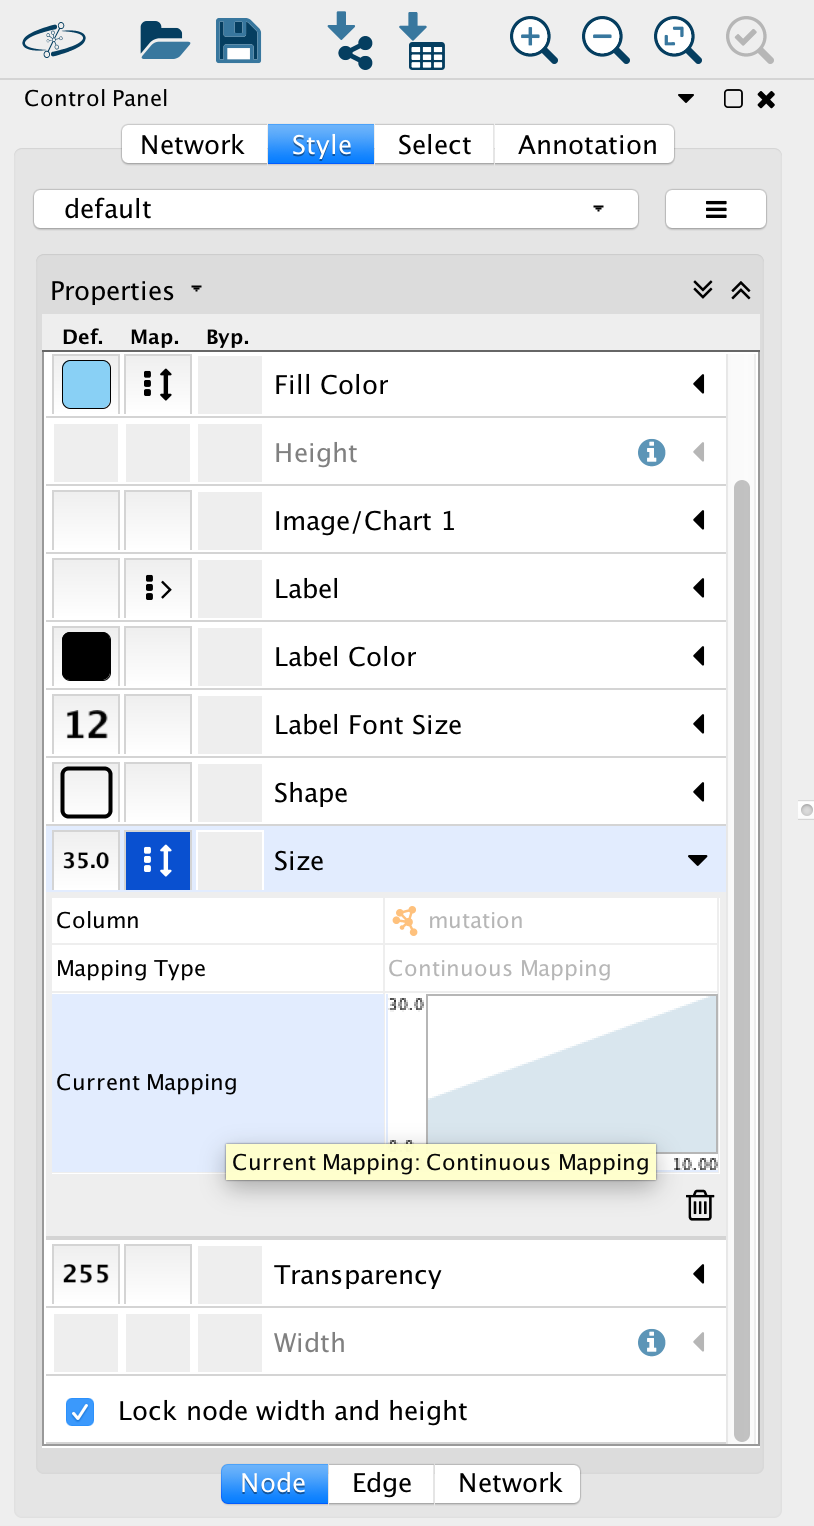
At the bottom of the “Style” tab, check the box “Lock node width and height”.
-
Select the “Size” field and expand it by clicking on the right arrow. Set “Column” to “mutation” and “Mapping Type” to “Continuous Mapping”.
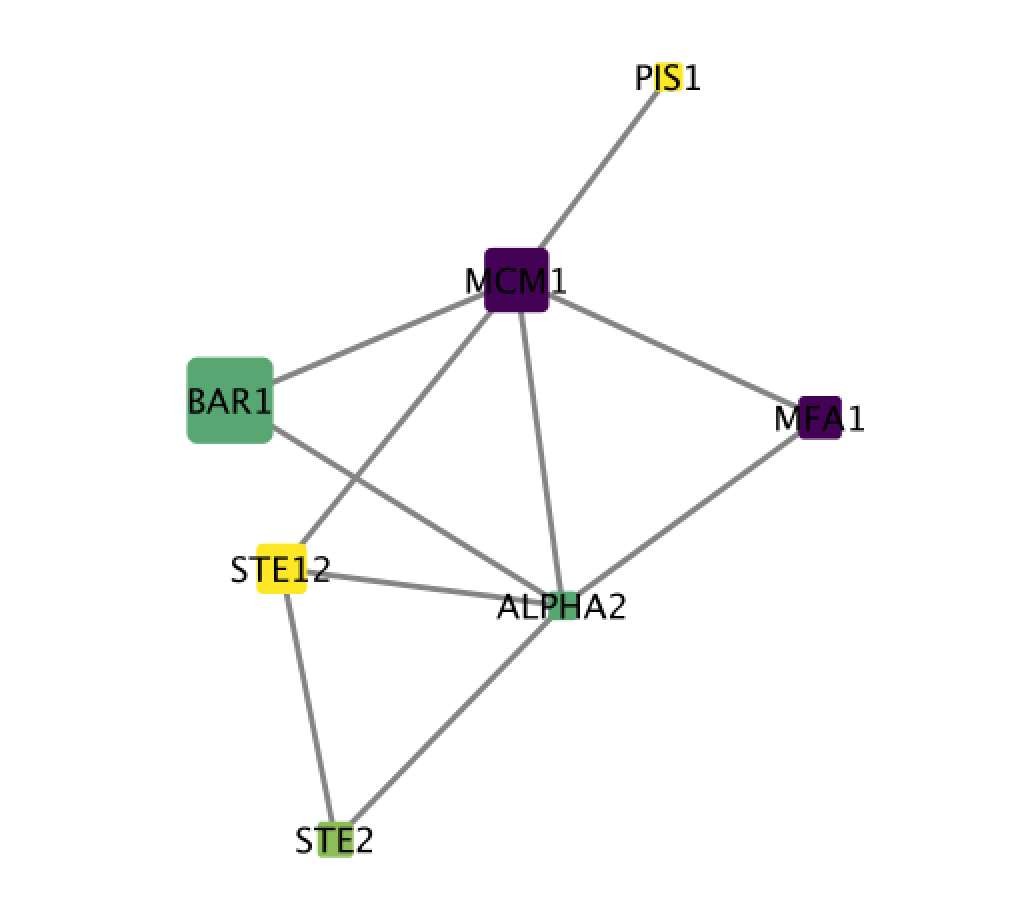
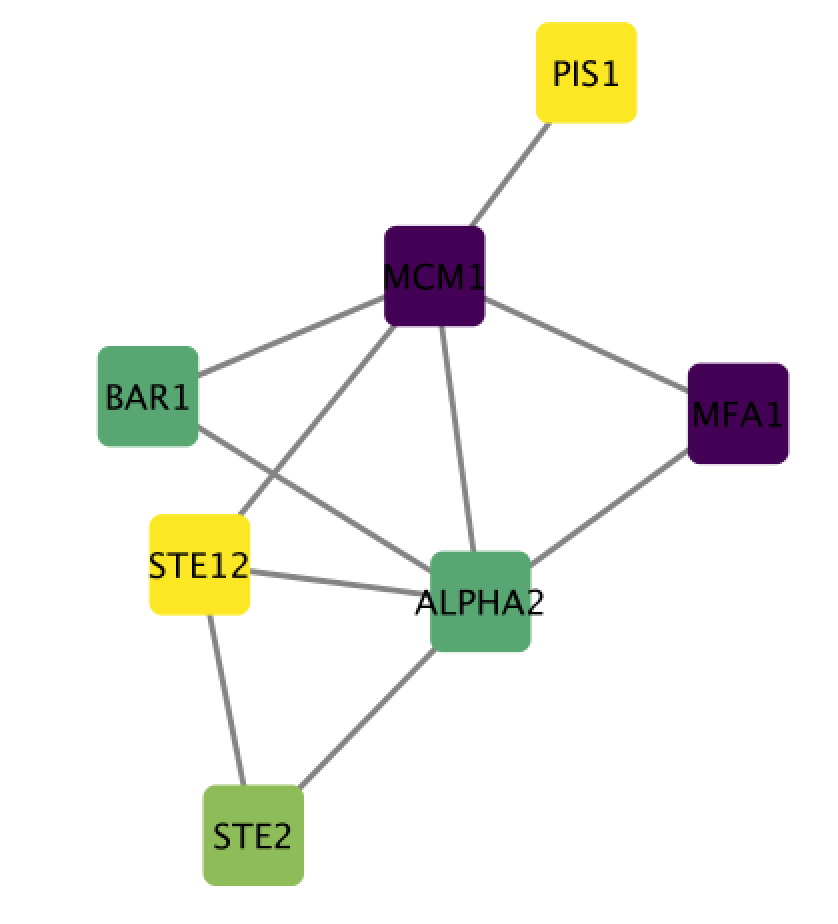
If successful, you should now have a network with nodes of different colors and sizes. Node size proportional to mutation and node color is related to expression levels of the proteins in the network.
EXERCISE ANSWERS: DETAILED EXPLANATION AND SCREENSHOTS
STEPS 1-3
STEPS 4-5
STEPS 6-7
STEPS 8-9