Infectious Disease Genomic Epidemiology
Table of contents
Introduction
This tutorial aims to introduce a variety of software and concepts related to detecting emerging pathogens from a complex host sample. Each exercise will demonstrate some of the concepts in current routine use.
All datasets have been modified to either illustrate a specific learning objective or to reduce the complexity of the problem. Contamination and a lack of large and accurate databases render detection of microbial pathogens difficult. As a disclaimer, all results produced from the tools described in this tutorial and others must also be verified with supplementary bioinformatics or wet-laboratory techniques.
List of software for tutorial
Exercise setup
To begin, we will copy over the exercises to ~/workspace. This let’s use view the resulting output files in a web browser.
cp -r ~/CourseData/IDGE_data/module6/module6_exercises/ ~/workspace/
Exercise 1
Patient Background:
On June 14, a 41-year old male was admitted to a local ER. He presented with fever, headache, and vomiting, but soon after admission began coughing up blood. He says he travels a lot and has most recently traveled through 3 continents: Europe, South America, and Africa. A sample was obtained from the patient and sequenced to gain any more insight on the cause of his illness.
Demonstration:
- Filter host reads with KAT
- Run Kraken with small bacterial and viral database
- Generate text and graphic reports with Kraken and Krona
Step 1: Host read filtering
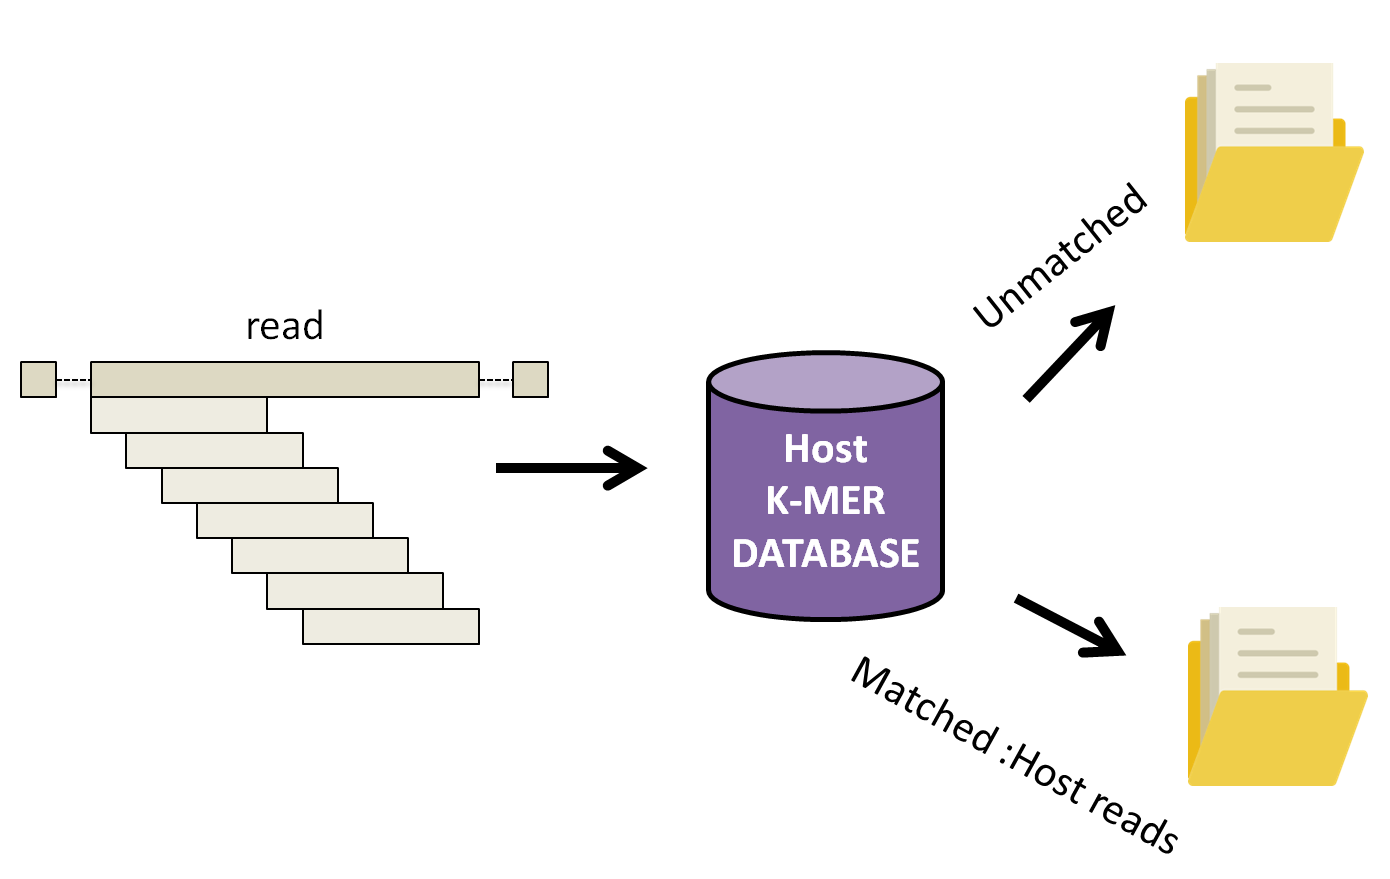
The first step is to remove the host reads from the dataset prior to downstream analysis. There are several different tools that can be used to filter out host reads such as Kraken, BLAST, KAT and others. In this demonstration, we have selected KAT because of the smaller memory requirement compared to Kraken and relatively quick speed.
Command documentation is available here
KAT works by breaking down each read into small fragements of length k, k-mers, and comparing them to a k-mer database of human reference genomes. Subsequently, the complete read is either assigned into a matched or unmatched file if 10% of the k-mers in the read have been found in the human database.
Let’s run KAT now.
cd ~/workspace/module6_exercises/ex1

kat filter seq -i -o unmatched --seq ex1_1.fastq --seq2 ex1_2.fastq ~/CourseData/IDGE_data/module6/kat_db/human_kmers.jf
Command arguments:
--seq --seq2arguments to provide corresponding forward and reverse fastq reads-iwhether to output sequences not found in the kmer hash, rather than those with a database hit (host sequences).-o unmatchedProvide prefix for all files generated by the command. In our case, we will have two output files unmatched.in.R1.fastq and unmatched.in.R2.fastq.~/CourseData/IDGE_data/module6/kat_db/human_kmers.jfthe human k-mer database
After the above command is done running, you should see similar output on your screen as shown below.
Kmer Analysis Toolkit (KAT) V2.4.1

Running KAT in filter sequence mode
-----------------------------------

Loading hashes into memory... done.  Time taken: 34.6s

Filtering sequences ...
Processed 100000 pairs
Finished filtering.  Time taken: 14.7s

Found 110056 / 162083 to keep

KAT filter seq completed.
Total runtime: 49.4s
If the command was successful, your current directory should contain two new files:
unmatched.in.R1.fastqunmatched.in.R2.fastq
Step 2: Classify reads against kraken database
Now that we have most, if not all, host reads filtered out, it’s time to classify the remaining reads.
Database selection is one of the most crucial parts of running Kraken. One of the many factors that must be considered is the computational resources available. Our current AWS image for the course has only 16G of memory. A major disadvantage of Kraken is that it loads the entire database into memory. With the full viral, bacterial, and archael database on the order of 200+ GB we would be unable to run the full database on the course machine (though the recently released Kraken 2 has done a lot to reduce database size). To help mitigate this, Kraken allows reduced databases to be constructed, which will still give reasonable results. We have constructed our own miniture Kraken database for this course, though a downloadable version is also provided by the authors (minikraken).
Lets run the following command in our current directory to classify our reads against the kraken database.
kraken --paired --threads 4 --db ~/CourseData/IDGE_data/module6/kraken_db/ unmatched.in.R1.fastq unmatched.in.R2.fastq > results_initial.txt
After the above command is done running, you should see similar output on your screen as shown below.
110056 sequences (32.66 Mbp) processed in 22.528s (293.1 Kseq/m, 86.98 Mbp/m).
  90212 sequences classified (81.97%)
  19844 sequences unclassified (18.03%)
Step 3: Generate text-based report using Kraken-report.
While this initial output file, results_initial.txt, is useful as input to some software, it is not really meant to be human readable. Lets convert this file to a human-readable format using kraken-report.
kraken-report --db ~/CourseData/IDGE_data/module6/kraken_db/ results_initial.txt > results_final.txt
Let’s look at the generated text report from Kraken-report by opening a web browser and navigate to http://XX.oicrcbw.ca, where XX is your student ID. You should be able to find and open the file results_final.txt in the following directory hierarchy module6_exercises/ex1/.
The output of kraken-report is easier to understand and interpret than the previous output we generated from Kraken (documeted here). The number on the left indicates the percentage of reads assigned to the taxonomic category listed at the very right.
To summarize this information into a single interactive figure, we can use Krona.
Step 4: Generate interactive html-based report using Krona
To generate a Krona figure, we first must make a file, krona_input.txt, containing a list of read IDs and the taxonomic IDs these reads were assigned. We can then run ktImportTaxonomy to create the figure. To do this, please run the following commands.
cut -f2,3 results_initial.txt > krona_input.txt

ktImportTaxonomy krona_input.txt -o final_web_report.html
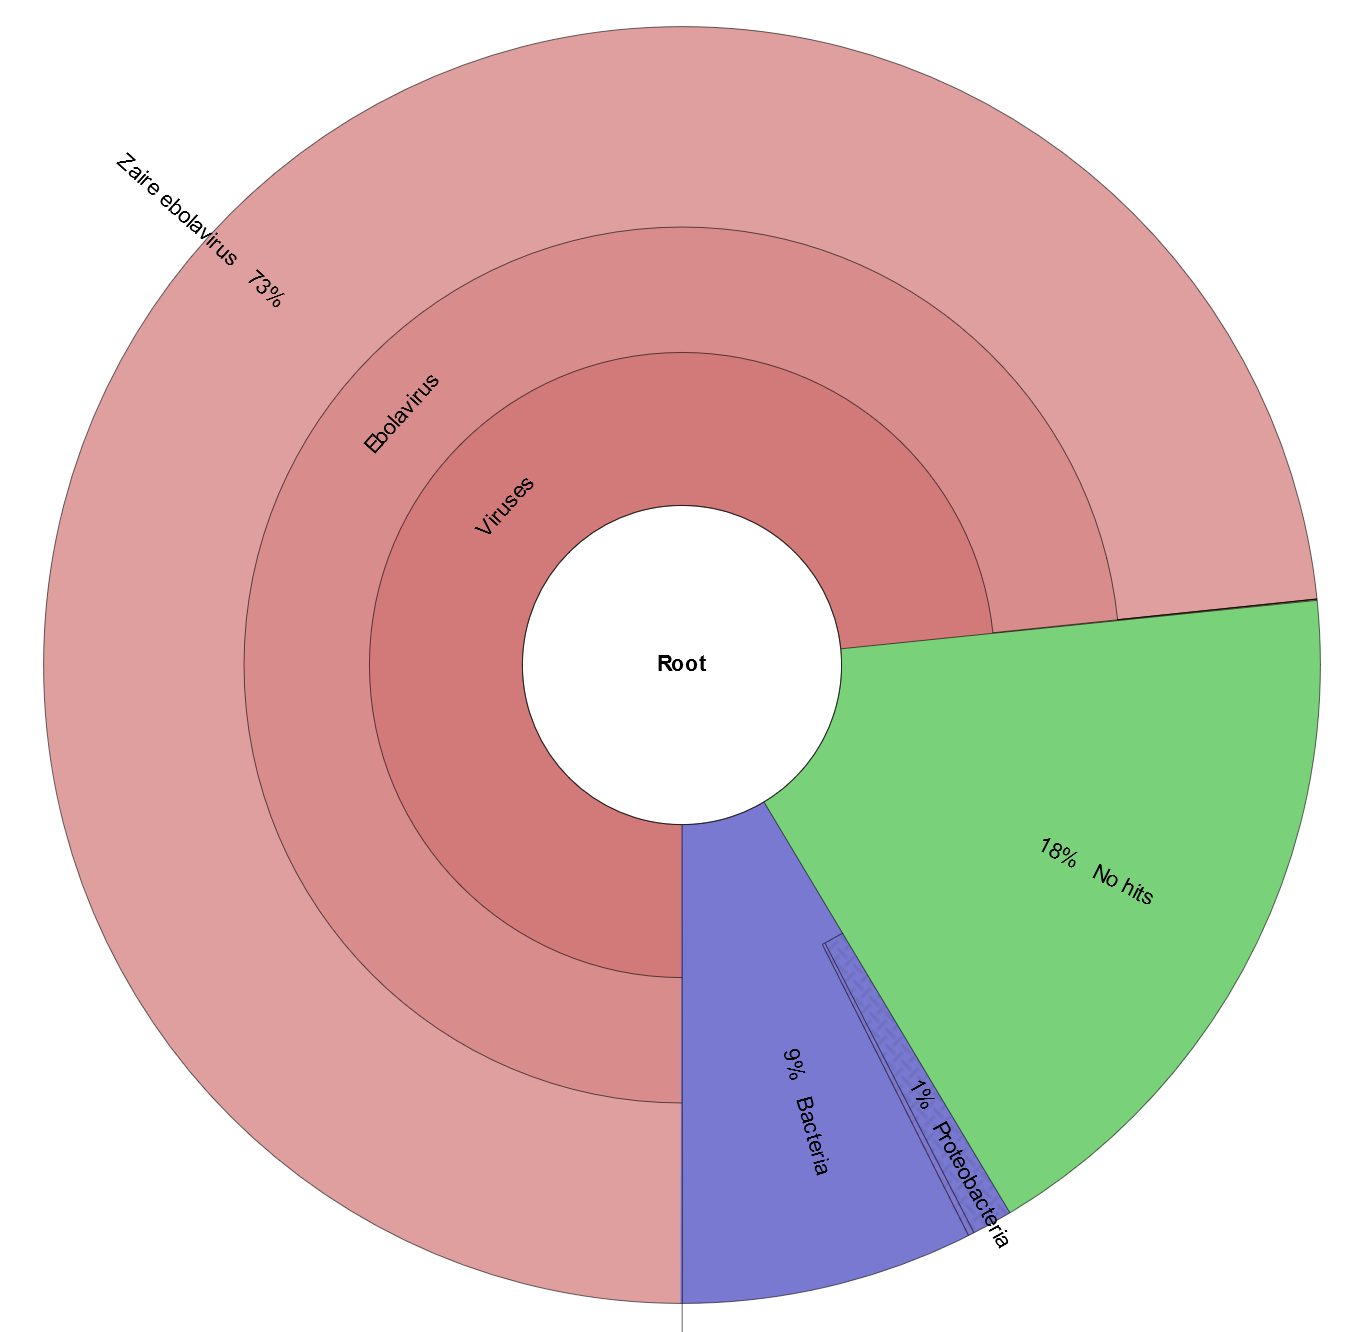
Let’s look at what Krona generated. Return to your web browser and refresh the page from Step 3 to see the new files added in the module6_exercises/ex1 directory.
Click on final_web_report.html. Note: if this is not working, what you should see is shown in the image here.
Questions
Note: Precomputed results are in ~/CourseData/IDGE_data/module6/example-outputs/ex1 if needed.
- Given the output of Krona (or the Kraken report), what do you hypothesize is causing the patient’s illness?
Exercise 2
Background:
On April 24, a 16-year old female was admitted to a local ER. She presented with high fever, muscle pain, and shortness of breath. CBC revealed elevated white blood cell count, neutrophils, etc. The hospital epidemiologist was consulted to confirm the clinician’s’ findings.
Demonstration:
- Filter host reads with KAT
- Run Kraken with bacterial and viral database
- Generate text and graphic reports with Kraken and Krona
- Assemble reads and send to NCBI BLAST for additional comparison
Step 1: Host read filtering
The first step in this demonstration is to remove the host reads from the dataset prior to downstream analyses.
cd ~/workspace/module6_exercises/ex2/

kat filter seq -i -o unmatched --seq ex2_1.fastq --seq2 ex2_2.fastq ~/CourseData/IDGE_data/module6/kat_db/human_kmers.jf
Step 2: Classify reads against Kraken database
Now let’s classify our reads against the Kraken database. Please make sure to include --unclassified-out as we will make use of this file.
kraken --paired --threads 4 --db ~/CourseData/IDGE_data/module6/kraken_db/ --unclassified-out unclassified.fasta unmatched.in.R1.fastq unmatched.in.R2.fastq > results_initial.txt
Let’s also construct a text report and a Krona chart.
kraken-report --db ~/CourseData/IDGE_data/module6/kraken_db/ results_initial.txt > results_final.txt

cut -f2,3 results_initial.txt > krona_input.txt

ktImportTaxonomy krona_input.txt -o final_web_report.html
Now we can take a look at the text report and Krona chart from module6_exercises/ex2/ in the web browser.
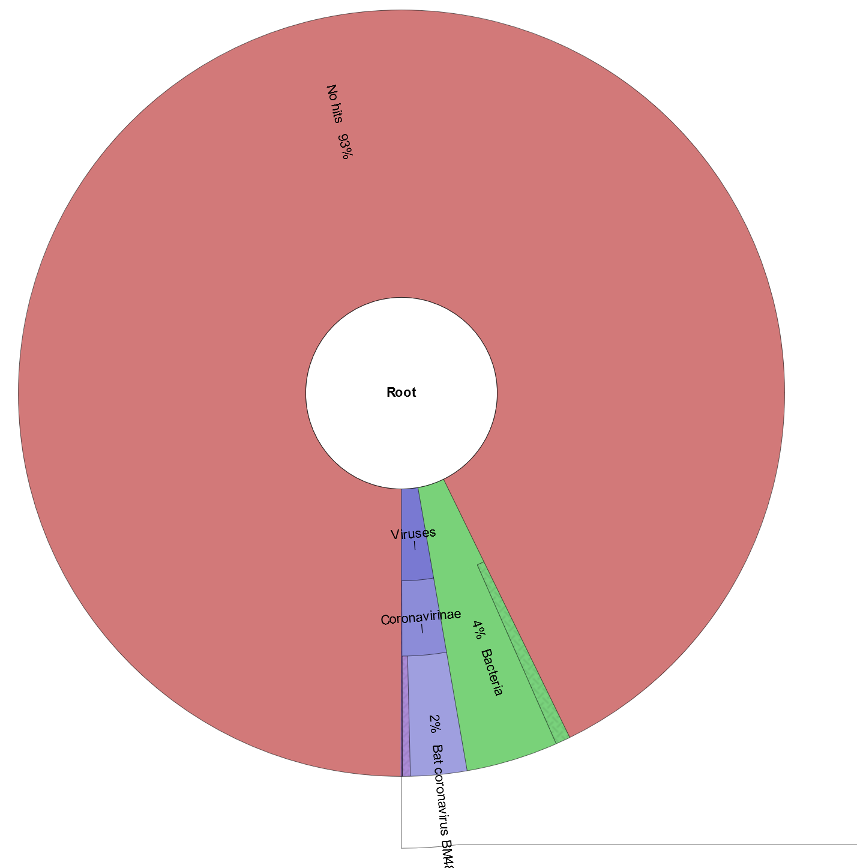
Huh!? That’s odd. It looks like ~90% of our reads are unclassified, even after removing host k-mers. These reads could all be sequencing artifacts, or they could indicate that the organism these reads belong to is not well-represented in our Kraken database (possibly even an emerging pathogen).
One option to get a bit more information about what’s going on would be to use a larger Kraken database, but this requires a lot more computer resources. Another option is to try and assemble the unclassified reads (unclassified.fasta) with SPAdes and see if we can make any sense of them. Let’s try this option.
SPAdes normally operates on reads in fastq format (sequence data plus quality scores), but kraken outputs the unclassified reads in fasta format (no quality score information). Quality scores are useful for correcting possible errors in the reads, but we can still assemble reads into contigs without them and get reasonable results (assuming the reads already are relatively error-free). Let’s do this now, disabling error correction with --only-assembler.
spades.py --only-assembler -s unclassified.fasta -o unclassified_results
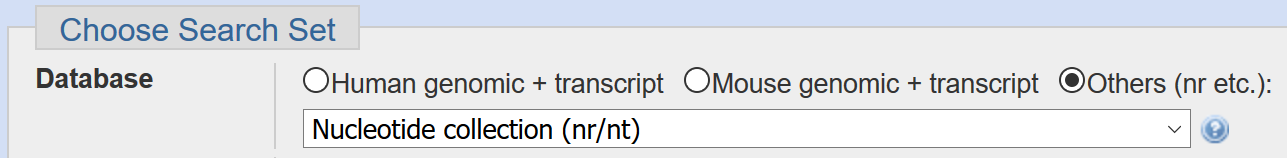
The assembled genome will be located under unclassified_results/contigs.fasta. In order to get a better idea of what’s in this data, let’s run the assembled contigs through NCBI BLAST and examine the matches (note, you can find and download the file by navigating through the filesystem in your web browser). Please make sure the nr database is selected when running BLAST:
Questions
Note: Precomputed results are in ~/CourseData/IDGE_data/module6/example-outputs/ex2 if needed.
-
Look through the matches for a few of the longest and highest-covered contigs in NCBI. Are there any matches that could tell you a bit more about what is responsible for the patient’s illness?
You can look through the results for different contigs in NCBI BLAST by using the drop-down menu shown below:
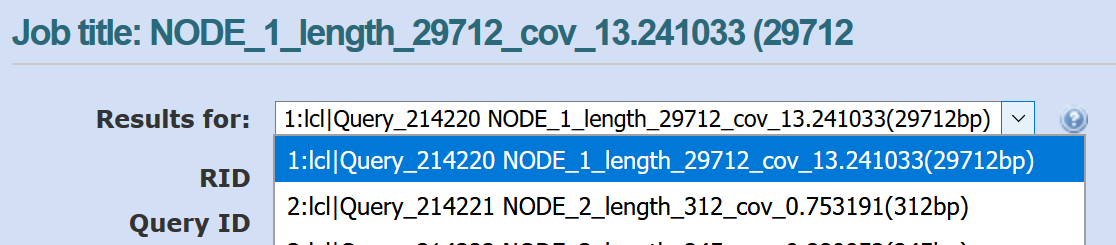
The length and coverage of the contig is listed in the sequence id (e.g., len_5000 for 5000 bp, cov_5.15 for an average coverage of 5.15). The coverage gives an indication of how much data (how many reads) were used to assemble this contig.
Note: We specifically removed the organism you will find from the Kraken database for this workshop. This organism would be found by Kraken for the standard bacterial/viral databases, but emerging pathogens may not be identified as easily.
- If this really was an emerging pathogen, what sort of results would you expect to get from BLAST (i.e., would you expect to get 100% full-length matches to some organism in NCBI)?
Paper
An evaluation of the accuracy and speed of metagenome analysis tools