High-Throughput Biology - From Sequence to Networks Module 13 Lab
This work is licensed under a Creative Commons Attribution-ShareAlike 3.0 Unported License. This means that you are able to copy, share and modify the work, as long as the result is distributed under the same license.
MODULE 13 LAB: PATHWAY OVER-REPRESENTATION ANALYSIS
By Jüri Reimand
Let’s get a few gene lists for analysis
Highlights:
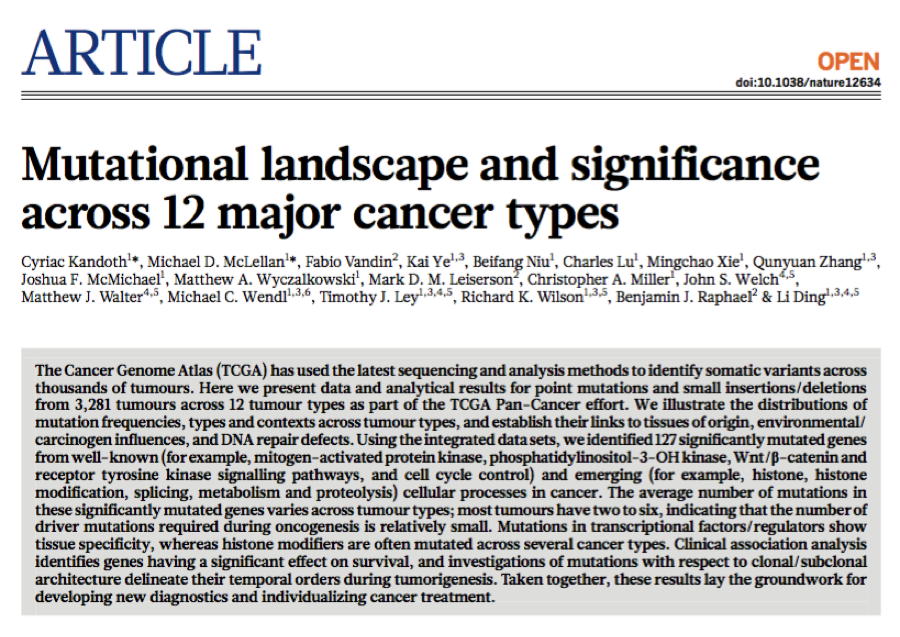
- Using the integrated data sets, the authors identified 127 significantly mutated genes as candidate cancer driver genes
- Genes under positive selection, either in individual or multiple tumour types, tend to display higher mutation frequencies above background.
- The statistical analysis identified 127 such genes
- The mutational significance in cancer (MuSiC) package was used to identify significant genes for both individual tumour types and the Pan-Cancer sample cohort. Dees et al. MuSiC: Identifying mutational significance in cancer genomes. Genome Res. 2012
- These significantly mutated genes are involved in a wide range of cellular processes, including transcription factors/regulators, histone modifiers, genome integrity, receptor tyrosine kinase signalling, cell cycle, mitogen- activated protein kinases (MAPK) signalling, phosphatidylinositol-3-OH kinase (PI(3)K) signalling, Wnt/b-catenin signalling, histones, ubiquitin- mediated proteolysis, and splicing (Fig. 2).
Supplementary Data, Table 4
- globally significant, frequency >= 1% for glioblastoma multiforme (GBM): 46
- globally significant, frequency >= 1% for kidney renal clear cell carcinoma (KIRC): 53
Let’s use g:Profiler to obtain enrichment results
First set the parameters and filter gene sets to be analysed:
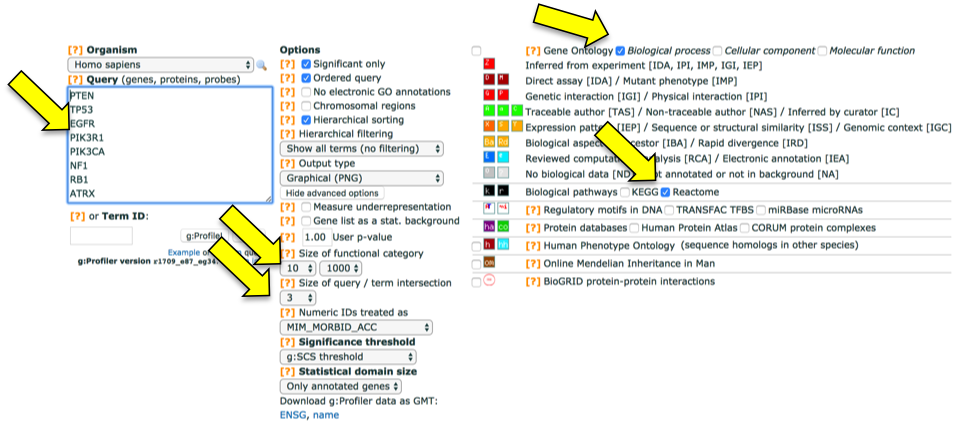
Note that input genes are ordered according to p-value so the Ordered Query option is appropriate.
Then paste the gene list (GBM shown here) and press g:Profile to start the analysis.
Scroll down to see significantly enriched pathways and processes. Scroll right to see gene annotations of GO processes (colored) and Reactome pathways (black; scroll further down).
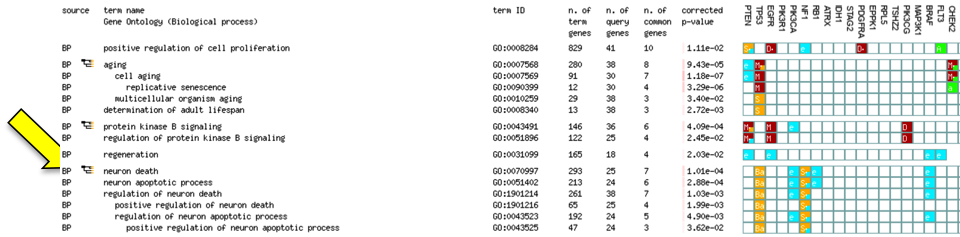
Browse results:
- Click on numbers in the column n. of common genes to find genes that are part of a given process.
- Click graph icon to see how processes are related to each other.
- Check checkbox No electronic GO annotations and run query again. Now you see the enrichment analysis that uses only high-confidence gene annotations.
- Uncheck checkbox Hierarchical sorting to reveal ranking of results by corrected p-value.
- Scroll all the way down and look at parameters and gene information. In particular, pay attention to unidentified gene symbols. In GBM, the symbols MLL2, MLL3, MLL4 are outdated and should be replaced with current IDs.
For Enrichment Map construction (for next tutorial):
- Set Output Type to Generic Enrichment Map (TAB).
- Click on g:Profile to run analysis again.
- Right-click on Download data in Generic Enrichment Map (GEM) format to save the file.
- At the bottom of Advanced Options, find Download g:Profiler data as GMT and right-click the link name to save the zip file with gene-set annotations.
- In the zip file, you will need the file hsapiens.pathways.NAME.gmt.
g:Cocoa – analysis of multiple gene lists:
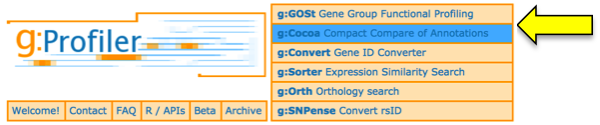
- Format your gene lists for g:Cocoa. You can analyse two or more gene lists by placing an identifier for every gene list before the gene list on a separate line:
> GBM_genes PTEN TP53 ... > KIRC_genes VHL PBRM1 .. - Paste the gene list into the Multi-query field and click on g:Cocoa to start.
g:Convert – gene ID conversion:
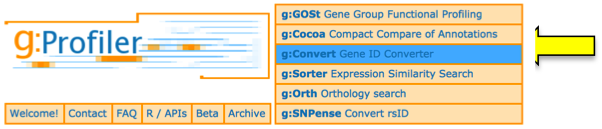
- Paste gene list into the Query box.
- In the Target Database list, select the desired type of gene/protein identifiers, for example UNIPROTSWISSPROT. Click Convert IDs to continue.