Infectious Disease Genomic Epidemiology
Table of contents
Introduction
This tutorial aims to introduce a variety of softwares and concepts related to how to detect emerging pathogens from a complex host sample. Each exercise will demonstrate some of the concepts in current routine use and hopefully be applied to future applications.
All datasets have been modified to either illustrate a specific learning objective or to reduce the complexity of the problem. Contamination and a lack of large and accurate databases render detection of microbial pathogens difficult. As a disclaimer, all results produced from the tools described in this tutorial and others must also be verified with supplementary bioinformatics or wet-laboratory techniques.
List of software for tutorial
To begin, we will setup our environment in our ~/workspace so we can view our progress using the web browser.
Environment setup
export WORK_DIR=~/workspace/module6/

mkdir -p $WORK_DIR

cd $WORK_DIR

ln -s ~/CourseData/IDGE_data/EPD_IMS .

mkdir $WORK_DIR/ex1 $WORK_DIR/ex2 $WORK_DIR/ex3
Exercise 1
Patient Background:
On April 27, a 66-year old male was admitted to a local ER. He presented with stiff neck and muscle aches. CBC revealed elevated white blood cell count, neutrophils, etc. The hospital epidemiologist was consulted to confirm the clinician’s findings.
Demonstration:
- Filter host reads with KAT
- Run Kraken with mini kraken database from RefSeq
- Generate text and graphic reports with Kraken and Krona
Step 1: Host read filtering
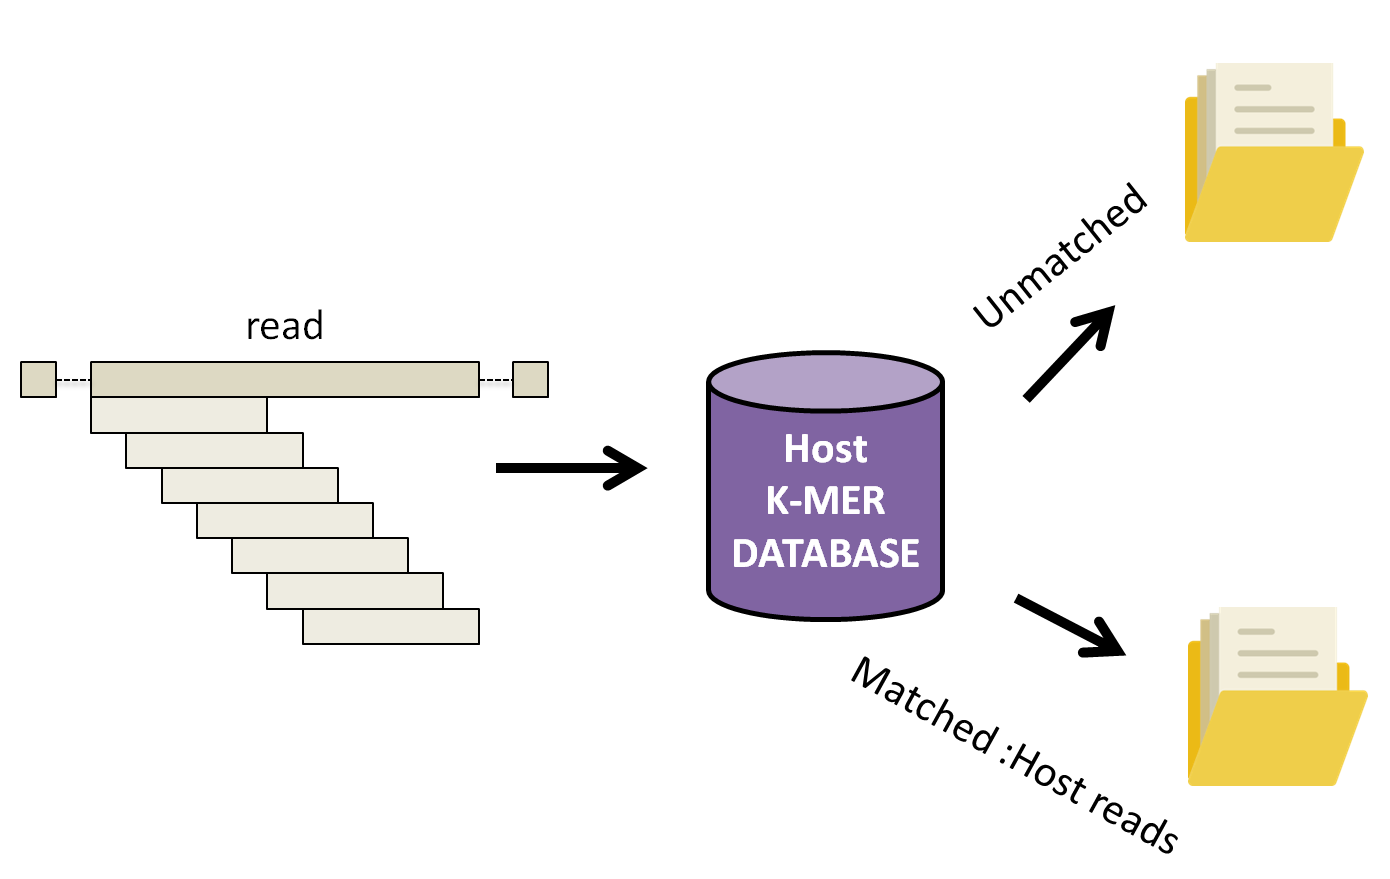
The first step in this demonstration is to remove the host reads from the dataset prior to downstream analysis. There are several different tools that can be used to filter out host reads such as Kraken, BLAST, KAT and others. In this demonstration, we have selected KAT because of the smaller memory requirement compared to Kraken and relatively quick speed.
Command documentation is available here
KAT works by breaking down each read into multiple 27 length k-mers and comparing them to a k-mer database of human reference genomes. Subsequently, the complete read is either assigned into a matched or unmatched file(s) if 10% of the k-mer in the read has been found in the human database.
cd $WORK_DIR/ex1

kat filter seq -i -o unmatched --seq ../EPD_IMS/reads/ex1/ex1_R1.fastq --seq2 ../EPD_IMS/reads/ex1/ex1_R2.fastq ../EPD_IMS/kat_db/human_kmers.jf
Command arguments:
--seq --seq2 arguments to provide corresponding forward and reverse fastq reads
-i whether to output sequences not found in the kmer hash, rather than those with a database hit (host sequences).
-o unmatched Provide prefix for all files generated by the command. In our case, we will have two output files unmatched.in.R1.fastq and umatched.inR1.fastq.
After the above command is done running, you should see similar output on your screen as shown below.
Kmer Analysis Toolkit (KAT) V2.3.3

Running KAT in filter sequence mode
-----------------------------------

Loading hashes into memory... done.  Time taken: 57.5s

Filtering sequences ...
Finished filtering.  Time taken: 14.2s

Found 32546 / 84573 to keep

KAT filter seq completed.
Total runtime: 71.8s
If the command was successful, your current directory should contain two new files:
- unmatched.in.R1.fastq
- unmatched.in.R2.fastq
Step 2: Classify reads against mini kraken database
Now that we have most, if not all, host reads filtered out, it’s now time to classify the remaining reads. Database(s) selection is one of the most crucial parts of running Kraken. One of the many factors that must be considered are the computational resources available. Our current AWS image for the course has only 16G of memory.
Though a popular database, a major disadvantage of Kraken is that it loads the entire database into memory. To help mitigate this, Kraken also provides a database, minikraken, which has been developed with these restrictions in mind. It is composed of a subset of complete bacterial, archaeal and viral genomes in RefSeq, with a total memory footprint of 4GB.
Now lets run the following command in our current directory to classify our reads against the minikraken database.
kraken --paired --threads 4 --db ../EPD_IMS/kraken_db/minikraken unmatched.in.R1.fastq unmatched.in.R2.fastq > results_initial.txt
After the above command is done running, you should see similar output on your screen as shown below.
32546 sequences (14.33 Mbp) processed in 60.511s (32.3 Kseq/m, 14.21 Mbp/m).
  32040 sequences classified (98.45%)
  506 sequences unclassified (1.55%)
We can try to take a look at the first 10 lines of output file results_initial.txt,
head results_initial.txt
though, these results are not really meant for human readable format. Each line in the report is an individual read on how well it mapped to entries in the database.
Documentation is brief but in sufficient detail available here and is subject to the following questions…
Questions
1) What does the ‘C’ value in the first column indicate?
2) What is the value given if a sequence is marked as unclassified?
Let’s generate something that would by running the Kraken-report command.
Step 3: Generate text-based report using Kraken-report.
kraken-report --db ../EPD_IMS/kraken_db/minikraken results_initial.txt > final_report.txt
Let’s look at the generated text report from Kraken-report by opening a web browser on your laptop, and navigate to http://cbwXX.dyndns.info/, where XX is your student ID. You should be able to find the file in the following directory hierarchy ~/workspace/modules6/ex1/ and open file final_report.txt
Now that the Kraken report is easier to understand and interpret than the previous output we generated from Kraken, it is still not as interactive as it could be. Documentation for kraken-report available here
That is where Krona comes in; Krona generates an interactive html web page that allows hierarchical data to be explored with zooming, multi-layered pie charts and other added features.
Step 4: Generate interactive html based report using Kraken-report.
cut -f2,3 results_initial.txt > krona_input.txt

ktImportTaxonomy krona_input.txt -o final_web_report.html
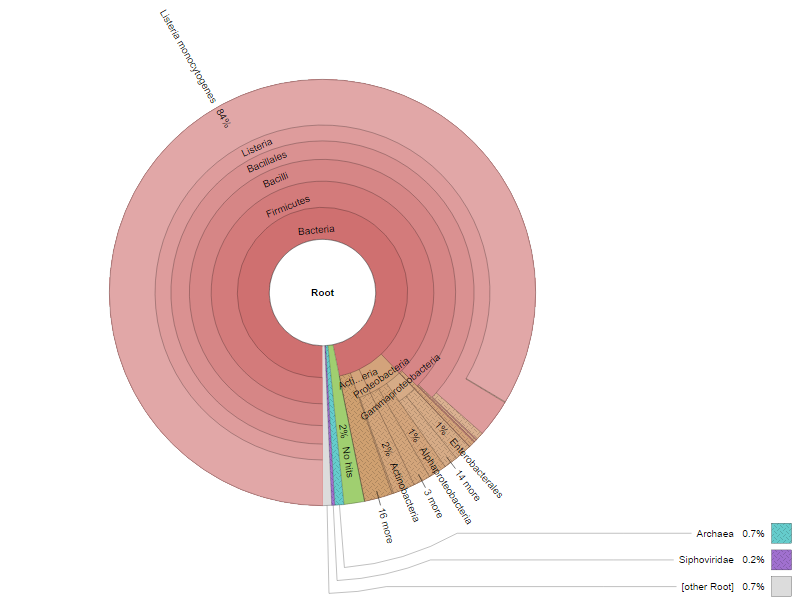
Let’s look at what Krona generated.
Return to your web browser and refresh the page from Step 3 to see the new files added in ~/workspace/modules6/ex1 directory.
Click on final_web_report.html and you should see the image below.
Questions
The following warning messages were printed from ktImportTaxonomy
   [ WARNING ]  The following taxonomy IDs were not found in the local database and were set to root (if they were recently added to NCBI, use updateTaxonomy.sh to update the local
                   database): 245018 1054400
Writing final_web_report.html...
   [ WARNING ]  Too many query IDs to store in chart; storing supplemental files in 'final_web_report.html.files'.
1) Why do you think taxonomy ID 245018 and 1054400 are missing? (Hint: search for them on NCBI)
2) What do you think the second warning message means? Will it affect the results?
3) In the kraken-report file, final_report.txt, there was a small percentage of the reads that were unclassified. What do you think they are? Is it important?
Exercise 2
Background:
On April 24, a 5-year old female was admitted to a local ER. She presented with high fever, chills and enlarged lymph nodes. CBC revealed elevated white blood cell count, neutrophils, etc. The hospital epidemiologist was consulted to confirm the clinician’s’ findings.
Demonstration:
- Filter host reads with KAT
- Run Kraken with specific bacterial and viral databases
- Generate text and graphic reports with Kraken and Kronatools
Step 1: Host read filtering
The first step in this demonstration is to remove the host reads from the dataset prior to downstream analyses.
cd ~/workspace/module6/ex2/

kat filter seq -i -o unmatched --seq ../EPD_IMS/reads/ex2/ex2_R1.fastq --seq2 ../EPD_IMS/reads/ex2/ex2_R2.fastq ../EPD_IMS/kat_db/human_kmers.jf
Step 2: Classify reads against bacterial kraken database
In the previous example, we were introduced to minikraken. Recall, minikraken is a smaller database that includes a subset of complete bacterial, archaeal and viral genomes in RefSeq. In the following example, we will be using multiple, larger databases to increase our confidence that the database(s) we use will be able to detect the microbial pathogen sequences present in our sample.
We will be using a parallel analysis pipeline in this approach as shown in the image below.
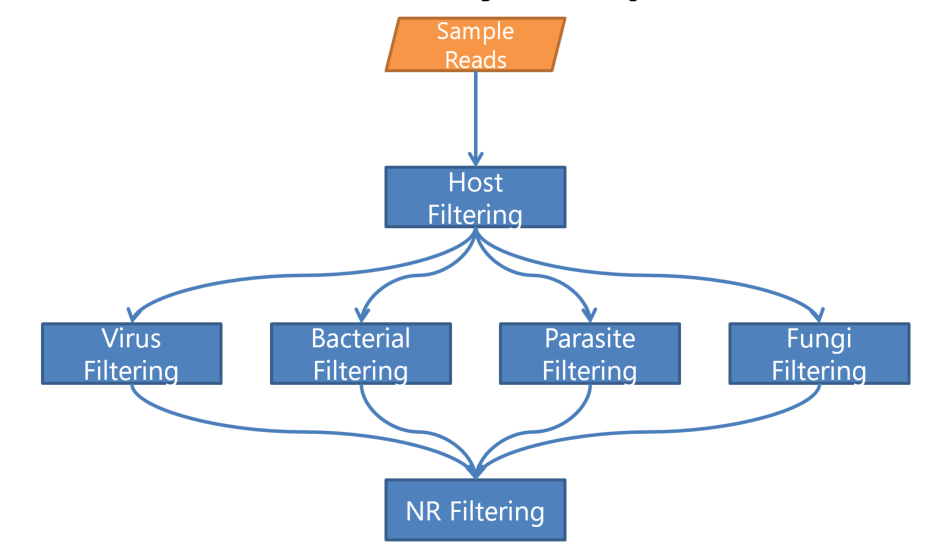
In the following exercise, we will run through both bacterial and viral databases, starting with the bacterial database.
kraken --paired --threads 4 --db  ../EPD_IMS/kraken_db/bacterial unmatched.in.R1.fastq  unmatched.in.R2.fastq  > results_bacterial.txt

kraken-report  --db ../EPD_IMS/kraken_db/bacterial results_bacterial.txt > bacterial_report.txt
Let’s open up the file ~/workspace/modules6/ex2/bacterial_report.txt in the web browser to visualize the results.
Looks like all the reads were marked as unclassified. One logical answer would be that our microbial pathogen of interest is not present in our database. Since we ran our reads against a bacterial database, perhaps we should try the viral one next.
Step 3: Classify reads against viral kraken database
Please note that we are running these commands on the reads generated from KAT and not output from the previous Kraken run. These are independent but parallel runs on the same data from KAT.
kraken --paired --threads 4 --db  ../EPD_IMS/kraken_db/viral unmatched.in.R1.fastq  unmatched.in.R2.fastq  > results_viral.txt

kraken-report  --db ../EPD_IMS/kraken_db/viral results_viral.txt > viral_report.txt
Open the file ~/workspace/modules6/ex2/viral_report.txt in your web browser to view the result. Looks like a large amount of our reads matched to the Orthopoxvirus genus; though we could not detect a species.
Questions
1) What microbe has caused the infection?
2) What advantages and disadvantages can you foresee when using the parallel analysis pipeline approach?
3) Using the viral_report, can you indicate with absolute certainty which species is our etiological culprit? Explain why or why not?
Exercise 3
Background:
On January 13th, a 78-year old male patient was rushed to the hospital from a long term care facility and died shortly upon arrival. Prior to the patient passing away, he was experiencing a high fever and shortness of breath. The patient’s medical history indicated he had multiple chronic illnesses for several years.
Demonstration:
- Filter host reads with KAT
- Run Kraken with bacterial and viral databases
- Extract unclassified reads from Kraken
- Generate an assembly using SPAdes
- BLAST contigs against NCBI nt database
Step 1: Host read filtering
Same instruction as listed in Exercise 1, Step 1 but using dataset found in ex3 folder.
cd ~/workspace/module6/ex3/

kat filter seq -i -o unmatched --seq ../EPD_IMS/reads/ex3/ex3_R1.fastq --seq2 ../EPD_IMS/reads/ex3/ex3_R2.fastq  ../EPD_IMS/kat_db/human_kmers.jf
Step 2: Classify reads against bacterial database
In the previous example, we used the parallel analysis approach to find the microbe in question. In the following exercise, we will be using a serial analysis pipeline .
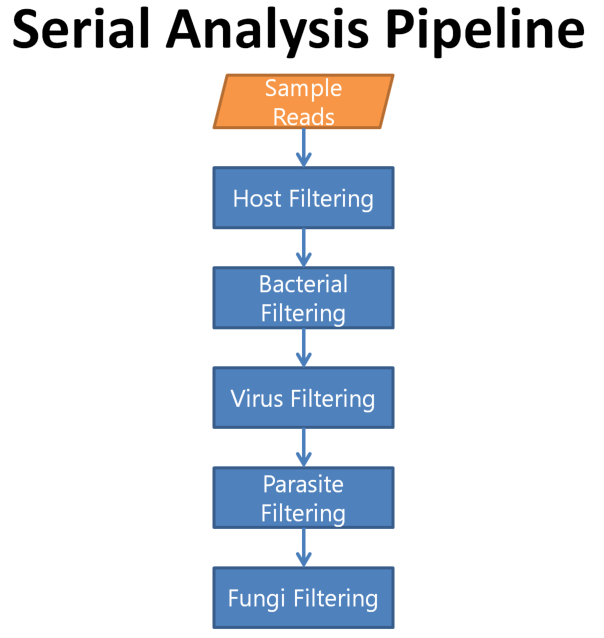
As we are performing a serial analysis, each step will utilize unclassified reads from the previous step rather than from the reads that did not match the host reads. A disadvantage of Kraken when outputting unclassified reads is that the quality values are lost when the user provides both forward and reverse fastq files as input. Hence, to keep Kraken from losing these quality values, we will combine our forward and reverse reads together thus treating them as a single-end reads.
cat unmatched.in.R1.fastq unmatched.in.R2.fastq > unmatched.fastq

kraken --threads 4 --db  ../EPD_IMS/kraken_db/bacterial unmatched.fastq  --unclassified-out unclassified_bact_reads.fastq > results_bacterial.txt

kraken-report  --db ../EPD_IMS/kraken_db/bacterial results_bacterial.txt > bacterial_report.txt
--unclassified-out print unclassified sequences to filename
Taking a look at our bacterial_report.txt using the web browser, we can see that nothing matched the database. Next, we will attempt to classify the ‘unclassified’ reads from the previous Kraken analysis against the viral database.
Step 3: Classify reads against the viral kraken database
Now attempt to run the viral database on the same output from unclassified reads from kraken bacterial.
kraken --threads 4 --db  ../EPD_IMS/kraken_db/viral  unclassified_bact_reads.fastq --unclassified-out unknown.fastq  > results_viral.txt

kraken-report  --db ../EPD_IMS/kraken_db/viral results_viral.txt > viral_report.txt
Open the viral_report.txt and scan the report to see if any reads were classified.
The report reveals that everything is unclassified again. Since we have been propagating our reads through the different Kraken databases (e.g. bacterial and viral), our next option to detect the microbe in question is to take all of the unclassified reads and assemble them using SPAdes.
Step 4: Generate an assembly with unclassified reads
We will be using default parameters for SPAdes.
More in-depth documentation can be found here.
spades.py -s unknown.fastq -o assembly_results
Note: it may take a few minutes for SPAdes to run to completion.
SPAdes has many different output files that are self-contained in a single directory. For now, we are only interested in the assembly_results/contigs.fasta.
For a quick search to see what has assembled, we will view the first 10 lines of the largest contig (which happens to be the top fasta entry in contigs.fasta) and do a BLAST on the NCBI server.
Step 4: BLAST partial contig(s) against NT database
Blast the subset of the top contig against NCBI’s nt database online
head -n 10 assembly_results/contigs.fasta

>NODE_1_length_8957_cov_2.90725
TAACTATGATGATCTTTTTGATGGAAACCATGAAGGTAATATTGAATCCATTTTTGAAGC
GAATGGTGAAGGCTGGGGATCTACAATCGGAGCATGGGGAACATCAATGTTTTACGGAAC
CGACTGGAAAAAGTTTAATACACCGGCTAATGCTTTAGTTAAAGCTTATGATGATGAAAA
AGATACGGTGAGAAAAAAATCTACAGTATGGTTCTCTGATAAAACCGTTTCATGGTCCGA
TACGTATTGGCCGTCATCTAATTTTCCGTTTGCCTATAAGATGAGAAAAACGGATGGTAC
ACAGAATTTTTATATTTTCAGATTGTCTGATATTTTATTATTGAAGGCAGAAGCGCAGGC
ACAAACGGGAGACCTCGCCGGTGCTGCGGTAAATGTTAATAAGATAAGAACAAGAGCAGC
ACTATCACCTGTTGCTTTCGCGACGAAGGCAGACGCAATTGATAAAATCCTAAAAGAACG
TTATCTGGAGCTTGCATTTGAGGGGCATCGTTGGTTTGATCTGAAAAGAACAGGGAAGTC
Navigate to NCBI Blast in your web browser and copy & paste the partial fasta contig into “Enter Query Sequence” textbox. From there, click on the BLAST button.
Questions
1) What species is being reported in BLAST? Is this our potential microbial pathogen of interest?
2) What advantages and disadvantages can you foresee when using the serial analysis pipeline approach?
3) With the viral_report, can you indicate with absolute certainty which species is our etiological culprit? Why or why not?
4) Why do you think we used SPAdes instead of metaSPAdes? Try it out on the server. (hint : metaspades.py is the tool name)
Paper
An evaluation of the accuracy and speed of metagenome analysis tools