Module 2: Bonus Exercise Results
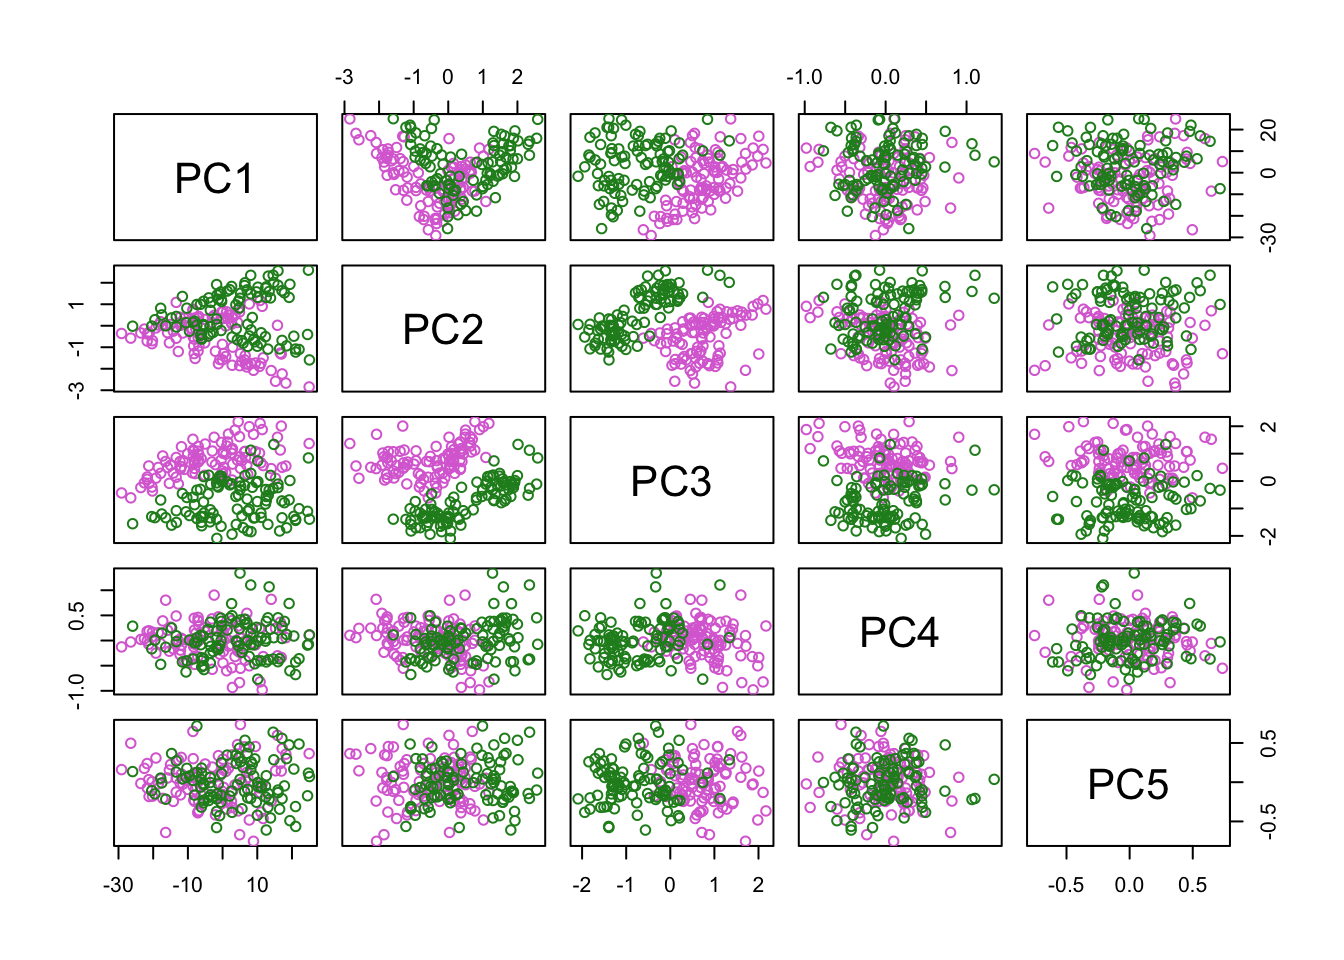
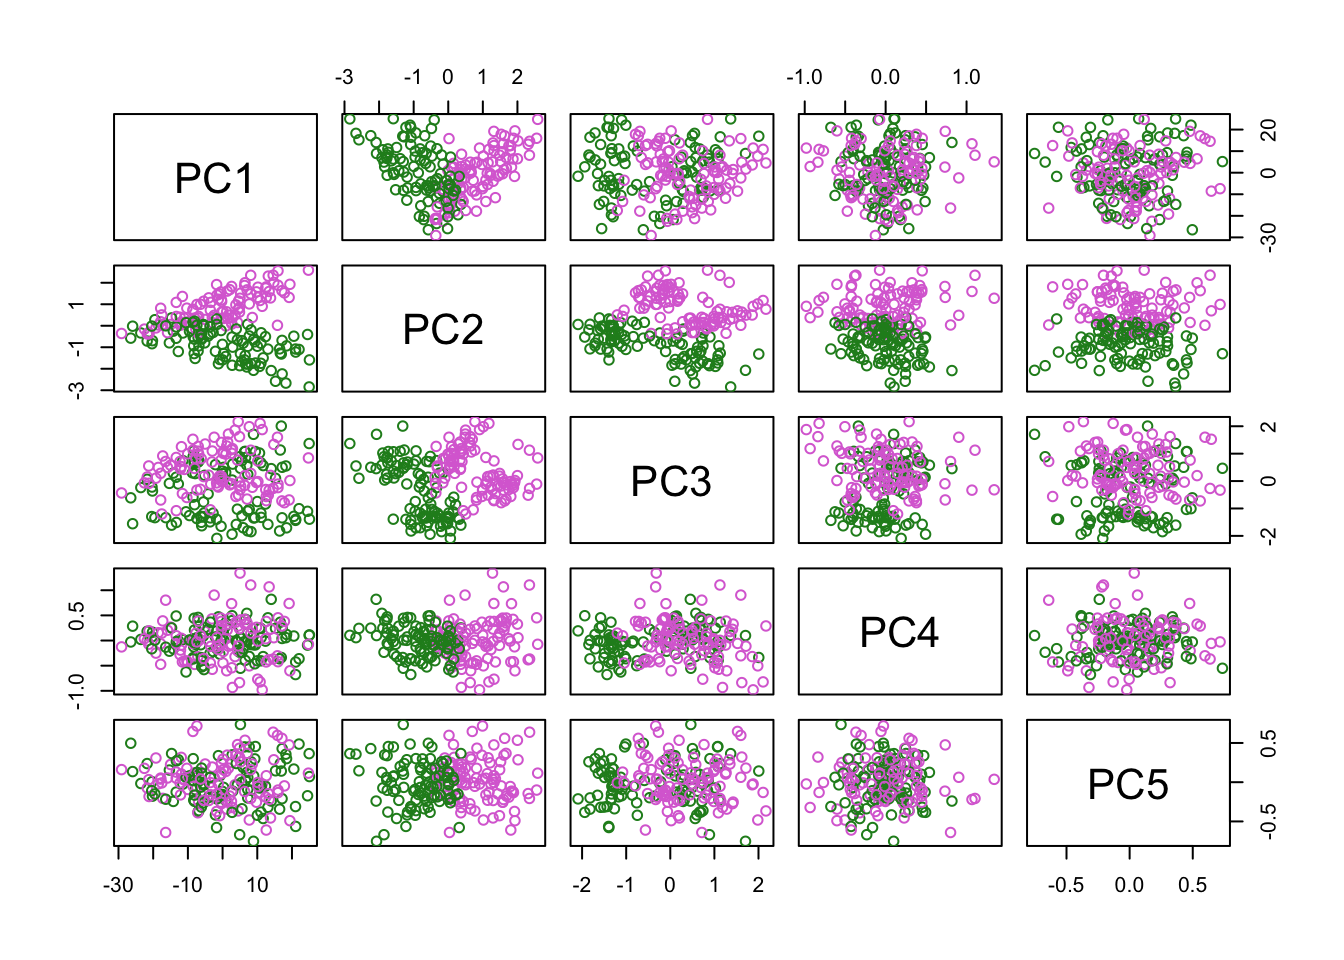
PCA
Plot PC projections (embeddings).
tSNE:
## sigma summary: Min. : 0.295392306171995 |1st Qu. : 0.424864940106807 |Median : 0.475900590252246 |Mean : 0.477263744443299 |3rd Qu. : 0.522810659014478 |Max. : 0.672971536327323 |## Epoch: Iteration #100 error is: 14.6669674525767## Epoch: Iteration #200 error is: 0.465465889645699## Epoch: Iteration #300 error is: 0.435757790287191## Epoch: Iteration #400 error is: 0.425311664262475## Epoch: Iteration #500 error is: 0.421470785377238## Epoch: Iteration #600 error is: 0.419233482585354## Epoch: Iteration #700 error is: 0.417911377087874## Epoch: Iteration #800 error is: 0.416752108062093## Epoch: Iteration #900 error is: 0.415898806246328## Epoch: Iteration #1000 error is: 0.414069633757249## sigma summary: Min. : 0.42069998064187 |1st Qu. : 0.505494820242659 |Median : 0.550282641638609 |Mean : 0.553782538032253 |3rd Qu. : 0.597446288884567 |Max. : 0.737568418500652 |## Epoch: Iteration #100 error is: 13.9599659396507## Epoch: Iteration #200 error is: 0.379056566514335## Epoch: Iteration #300 error is: 0.357523195588169## Epoch: Iteration #400 error is: 0.353181740043937## Epoch: Iteration #500 error is: 0.351078936228493## Epoch: Iteration #600 error is: 0.349768012171594## Epoch: Iteration #700 error is: 0.348957640897146## Epoch: Iteration #800 error is: 0.348451722454254## Epoch: Iteration #900 error is: 0.34817415726611## Epoch: Iteration #1000 error is: 0.348011884587493## sigma summary: Min. : 0.539839363698465 |1st Qu. : 0.634067694694373 |Median : 0.675230651916411 |Mean : 0.676426601512199 |3rd Qu. : 0.712708887622463 |Max. : 0.85041386579969 |## Epoch: Iteration #100 error is: 12.9363552405265## Epoch: Iteration #200 error is: 0.385680569392373## Epoch: Iteration #300 error is: 0.382013940523326## Epoch: Iteration #400 error is: 0.382013661049581## Epoch: Iteration #500 error is: 0.382013661049348## Epoch: Iteration #600 error is: 0.382013661049346## Epoch: Iteration #700 error is: 0.38201366104934## Epoch: Iteration #800 error is: 0.382013661049339## Epoch: Iteration #900 error is: 0.382013661049342## Epoch: Iteration #1000 error is: 0.382013661049339## sigma summary: Min. : 0.689338665294285 |1st Qu. : 0.801156853023062 |Median : 0.838030059692607 |Mean : 0.83585263946599 |3rd Qu. : 0.869043547272454 |Max. : 1.00462478171883 |## Epoch: Iteration #100 error is: 11.1940341786684## Epoch: Iteration #200 error is: 0.226277779269117## Epoch: Iteration #300 error is: 0.212882659495643## Epoch: Iteration #400 error is: 0.212881985379496## Epoch: Iteration #500 error is: 0.212881984821169## Epoch: Iteration #600 error is: 0.212881984820399## Epoch: Iteration #700 error is: 0.212881984820421## Epoch: Iteration #800 error is: 0.212881984820413## Epoch: Iteration #900 error is: 0.212881984820417## Epoch: Iteration #1000 error is: 0.212881984820416sex_cols = c(“orchid”,“forestgreen”)[factor(crabs$sex)]
Color-code tSNE plot by species, try various perplexity levels:
species_cols = c("orchid","forestgreen")[factor(crabs$sp)]
par(mfrow=c(2,2))
plot(c_tsne10[,1],
     c_tsne10[,2],
     main = "Perplexity = 10",
     col = species_cols)

plot(c_tsne20[,1],
     c_tsne20[,2],
     main = "Perplexity = 20",
     col = species_cols)
plot(c_tsne50[,1],
     c_tsne50[,2],
     main = "Perplexity = 50",
     col = species_cols)
plot(c_tsne100[,1],
     c_tsne100[,2],
     main = "Perplexity = 100",
     col = species_cols)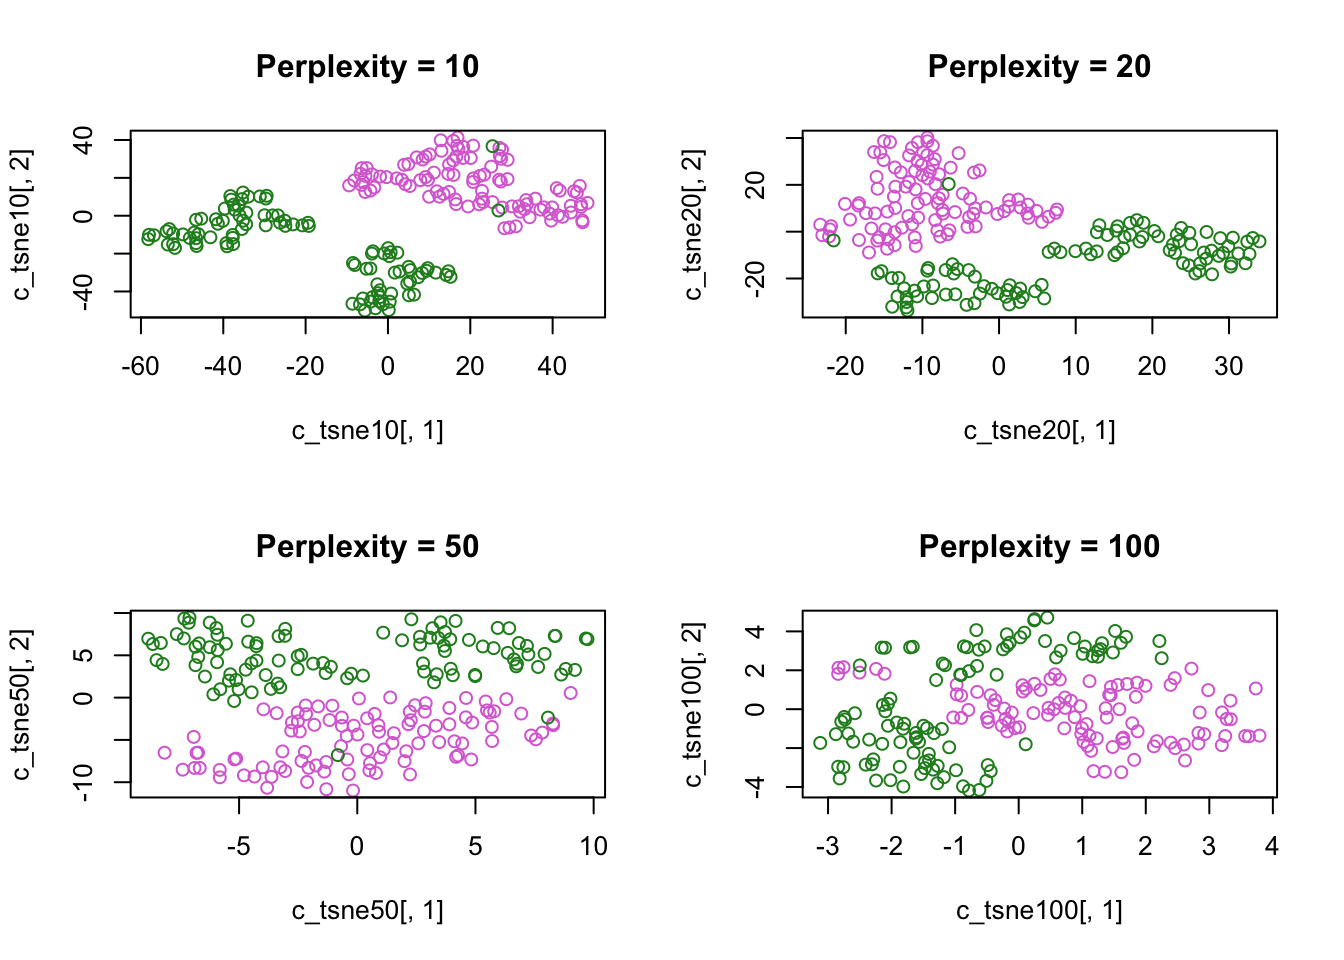
Now do the same, but colour-code for sex:
sex_cols = c("orchid","forestgreen")[factor(crabs$sex)]
par(mfrow=c(2,2))
plot(c_tsne10[,1],
     c_tsne10[,2],
     main = "Perplexity = 10",
     col = sex_cols)
plot(c_tsne20[,1],
     c_tsne20[,2],
     main = "Perplexity = 20",
     col = sex_cols)
plot(c_tsne50[,1],
     c_tsne50[,2],
     main = "Perplexity = 50",
     col = sex_cols)
plot(c_tsne100[,1],
     c_tsne100[,2],
     main = "Perplexity = 100",
     col = sex_cols)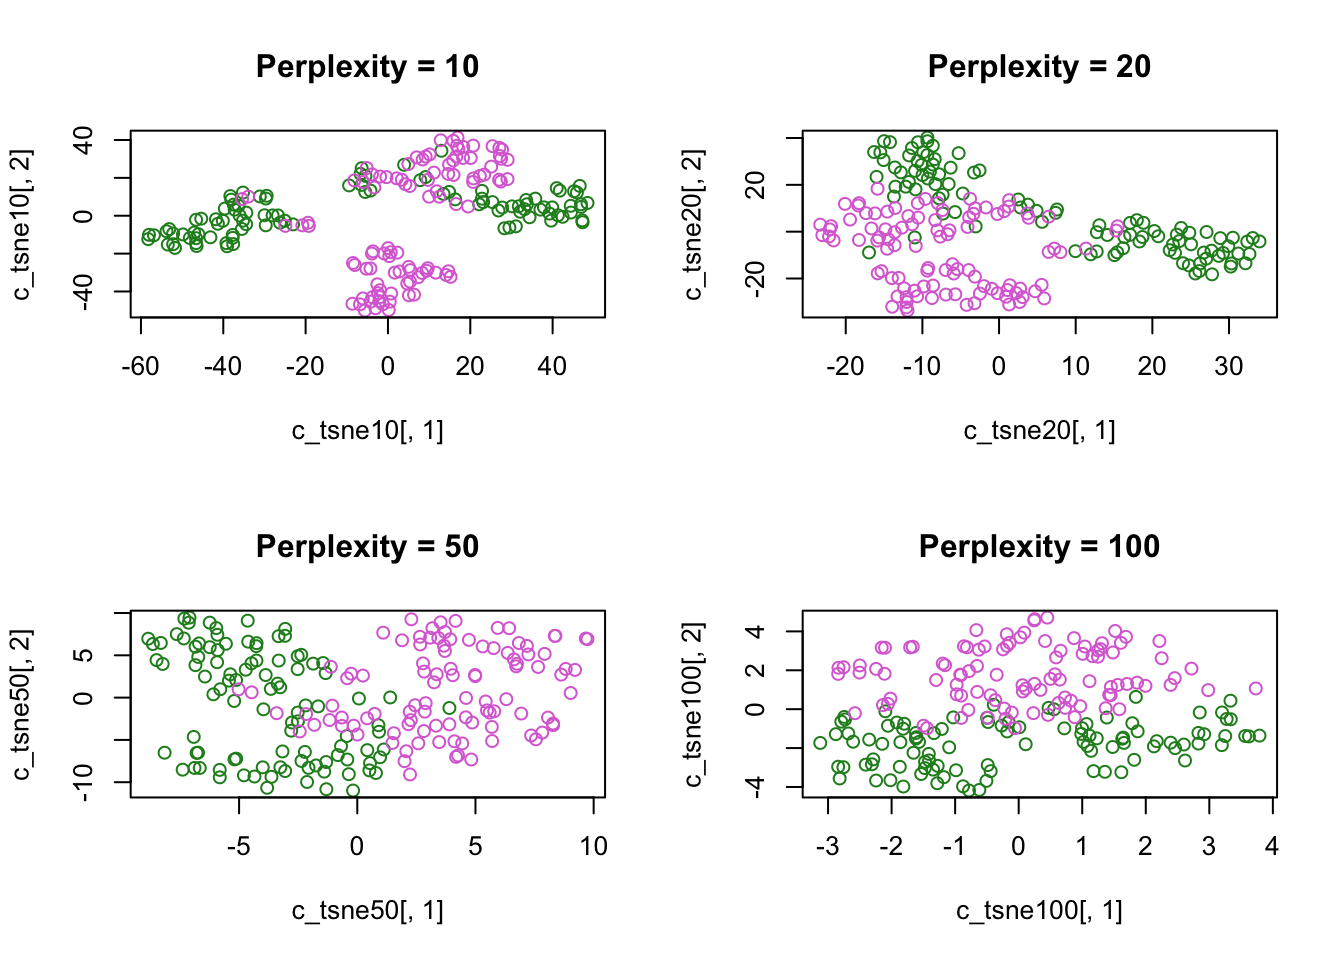
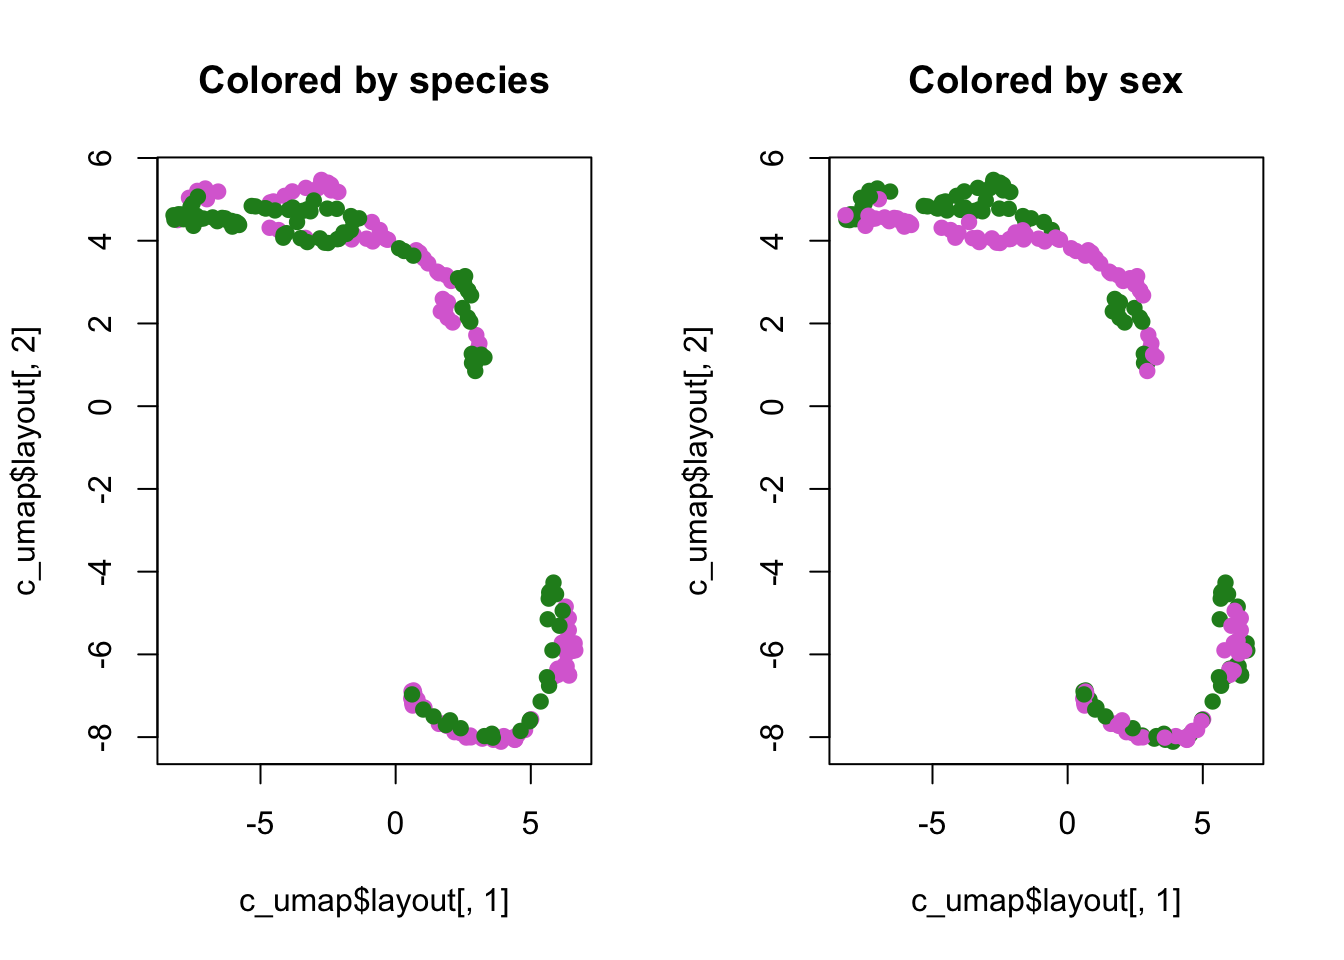
Run UMAP
## List of 4
##  $ layout: num [1:200, 1:2] 0.469 0.585 0.703 1.114 1.037 ...
##   ..- attr(*, "dimnames")=List of 2
##   .. ..$ : chr [1:200] "1" "2" "3" "4" ...
##   .. ..$ : NULL
##  $ data  : num [1:200, 1:5] 8.1 8.8 9.2 9.6 9.8 10.8 11.1 11.6 11.8 11.8 ...
##   ..- attr(*, "dimnames")=List of 2
##   .. ..$ : chr [1:200] "1" "2" "3" "4" ...
##   .. ..$ : chr [1:5] "FL" "RW" "CL" "CW" ...
##  $ knn   :List of 2
##   ..$ indexes  : int [1:200, 1:15] 1 2 3 4 5 6 7 8 9 10 ...
##   .. ..- attr(*, "dimnames")=List of 2
##   .. .. ..$ : chr [1:200] "1" "2" "3" "4" ...
##   .. .. ..$ : NULL
##   ..$ distances: num [1:200, 1:15] 0 0 0 0 0 0 0 0 0 0 ...
##   .. ..- attr(*, "dimnames")=List of 2
##   .. .. ..$ : chr [1:200] "1" "2" "3" "4" ...
##   .. .. ..$ : NULL
##   ..- attr(*, "class")= chr "umap.knn"
##  $ config:List of 24
##   ..$ n_neighbors         : int 15
##   ..$ n_components        : int 2
##   ..$ metric              : chr "euclidean"
##   ..$ n_epochs            : int 200
##   ..$ input               : chr "data"
##   ..$ init                : chr "spectral"
##   ..$ min_dist            : num 0.1
##   ..$ set_op_mix_ratio    : num 1
##   ..$ local_connectivity  : num 1
##   ..$ bandwidth           : num 1
##   ..$ alpha               : num 1
##   ..$ gamma               : num 1
##   ..$ negative_sample_rate: int 5
##   ..$ a                   : num 1.58
##   ..$ b                   : num 0.895
##   ..$ spread              : num 1
##   ..$ random_state        : int 401678036
##   ..$ transform_state     : int NA
##   ..$ knn                 : logi NA
##   ..$ knn_repeats         : num 1
##   ..$ verbose             : logi FALSE
##   ..$ umap_learn_args     : logi NA
##   ..$ method              : chr "naive"
##   ..$ metric.function     :function (m, origin, targets)
##   ..- attr(*, "class")= chr "umap.config"
## - attr(*, "class")= chr "umap"par(mfrow=c(1,2))
plot(c_umap$layout[,1],
c_umap$layout[,2],
col = species_cols, pch = 19,
main = "Colored by species")
plot(c_umap$layout[,1],
c_umap$layout[,2],
col = sex_cols, pch = 19,
main = "Colored by sex")