Cancer Analyis 2021 Module 3
Module 3: Genome Alignment
By Mathieu Bourgey, Ph.D
https://bitbucket.org/mugqic/genpipes
================================
This work is licensed under a Creative Commons Attribution-ShareAlike 3.0 Unported License. This means that you are able to copy, share and modify the work, as long as the result is distributed under the same license.
================================
In this workshop, we will present the main steps that are commonly used to process and to analyze cancer sequencing data. We will focus only on whole genome data and provide command lines that allow creating high quality alignment files usable for variant detection. This workshop will show you how to launch individual the first steps of a complete DNA-Seq SNV pipeline using to analyze cancer data
Data Source
We will be working on a CageKid sample pair, patient C0098. The CageKid project is part of ICGC and is focused on renal cancer in many of it’s forms. The raw data can be found on EGA and calls, RNA and DNA, can be found on the ICGC portal. For more details about CageKid
For practical reasons we subsampled the reads from the sample because running the whole dataset would take way too much time and resources.
All data used and generated in this workshop is accessible here
Environment setup
mkdir -p $HOME/workspace/CBW_CAN_2021/Module3/

docker run --privileged -v /tmp:/tmp --network host -it -w $PWD -v $HOME:$HOME \
--user $UID:$GROUPS -v /etc/group:/etc/group  -v /etc/passwd:/etc/passwd \
-v /etc/fonts/:/etc/fonts/ -v /media:/media c3genomics/genpipes:0.8


export REF=$MUGQIC_INSTALL_HOME/genomes/species/Homo_sapiens.GRCh37/


cd $HOME/workspace/CBW_CAN_2021/Module3/

ln -s $HOME/CourseData/CAN_data/Module3/* .
Software requirements
These are all already installed, but here are the original links.
We should load the corresponding modules
module load mugqic/java/openjdk-jdk1.8.0_72 \
   mugqic/bvatools/1.6 \
   mugqic/trimmomatic/0.36 \
   mugqic/samtools/1.9 \
   mugqic/bwa/0.7.17 \
   mugqic/GenomeAnalysisTK/4.1.0.0 \
   mugqic/R_Bioconductor/3.5.0_3.7
Original Setup
The initial structure of your folders should look like this:
<ROOT>
|-- raw_reads/               # fastqs from the center (down sampled)
    `-- normal               # The blood sample directory
        `-- run*_?           # Lane directory by run number. Contains the fastqs
    `-- tumor                # The tumor sample directory
        `-- run*_?           # Lane directory by run number. Contains the fastqs
|-- savedResults             # Folder containing precomputed results
|-- scripts                  # cheat sheet folder
|-- adapters.fa              # fasta file containing the adapter used for sequencing
Cheat file
- You can find all the unix command lines of this practical in the file: commands.sh
First data glance
So you’ve just received an email saying that your data is ready for download from the sequencing center of your choice.
What should you do ? solution
Fastq files
Let’s first explore the fastq file.
Try these commands
zless -S raw_reads/normal/run62DVGAAXX_1/normal.64.pair1.fastq.gz
Why was it like that ? solution
Now try these commands:
zcat raw_reads/normal/run62DVGAAXX_1/normal.64.pair1.fastq.gz | head -n4
zcat raw_reads/normal/run62DVGAAXX_1/normal.64.pair2.fastq.gz | head -n4
What was special about the output ? Why was it like that? Solution
You could also just count the reads
zgrep -c "^@HWUSI" raw_reads/normal/run62DVGAAXX_1/normal.64.pair1.fastq.gz
We should obtain 4003 reads
Quality
We can’t look at all the reads. Especially when working with whole genome 50x data. You could easily have Billions of reads.
Tools like FastQC and BVATools readsqc can be used to plot many metrics from these data sets.
Let’s look at the data:
# Generate original QC
mkdir -p originalQC/
java -Xmx1G -jar ${BVATOOLS_JAR} readsqc --quality 64 \
  --read1 raw_reads/normal/run62DVGAAXX_1/normal.64.pair1.fastq.gz \
  --read2 raw_reads/normal/run62DVGAAXX_1/normal.64.pair2.fastq.gz \
  --threads 2 --regionName normalrun62DVGAAXX_1 --output originalQC/
To view the images hosted on your AWS instance, open an internet browser tab and type in http://<your IPv4 or your IPv4 DNS>, where you replace "<IPv4 or your IPv4 DNS>" with the ID for your AWS instance. This is the same ID you used to ssh into your instance (ssh -i CBW.pem ubuntu@<your IPv4 or your IPv4 DNS>). From here you can navigate through the files in your AWS workspace. The images are stored in CBW_CAN_2021/Module3/originalQC.
All the generated graphics have their uses. But 3 of them are particularly useful to get an overal picture of how good or bad a run went. - The Quality box plots - The nucleotide content graphs. - The Box plot shows the quality distribution of your data.
The quality of a base is computated using the Phread quality score.
The quality of a base is computated using the Phread quality score.

In the case of base quality the probability use represents the probability of base to have been wrongly called
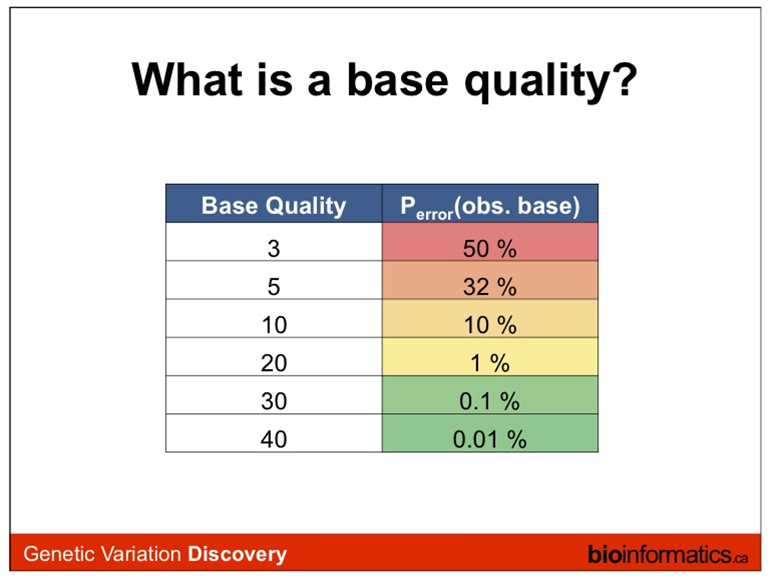
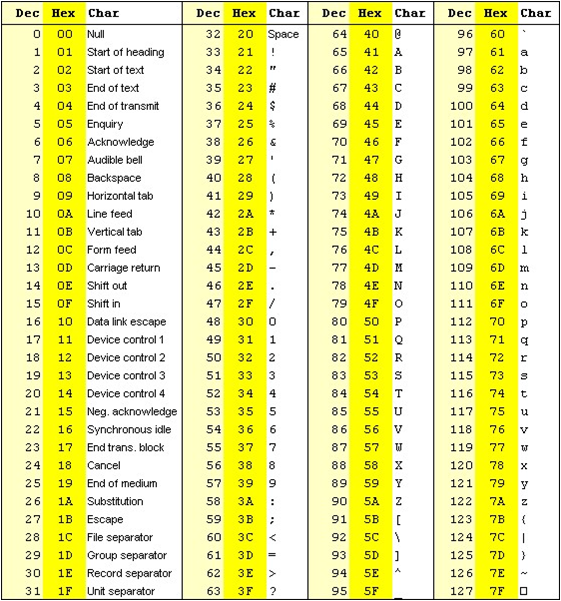
The formula outputs an integer that is encoded using an ASCII table.
The way the lookup is done is by taking the the phred score adding 33 and using this number as a lookup in the table.
Older illumina runs, and the data here, were using phred+64 instead of phred+33 to encode their fastq files.
What stands out in the graphs ? Solution
Why do we see adapters ? solution
Although nowadays this doesn’t happen often, it does still happen. In some cases, miRNA, it is expected to have adapters.
Trimming
Since adapter are not part of the genome they should be removed
To do that we will use Trimmomatic.
The adapter file is in your work folder.
cat adapters.fa
Why are there 2 different ones ? Solution
trimming with trimmomatic:
# Trim and convert data
for file in raw_reads/*/run*_?/*.pair1.fastq.gz;
do
  FNAME=`basename $file`;
  DIR=`dirname $file`;
  OUTPUT_DIR=`echo $DIR | sed 's/raw_reads/reads/g'`;

  mkdir -p $OUTPUT_DIR;
  java -Xmx2G -cp $TRIMMOMATIC_JAR org.usadellab.trimmomatic.TrimmomaticPE -threads 2 -phred64 \
    $file \
    ${file%.pair1.fastq.gz}.pair2.fastq.gz \
    ${OUTPUT_DIR}/${FNAME%.64.pair1.fastq.gz}.t30l50.pair1.fastq.gz \
    ${OUTPUT_DIR}/${FNAME%.64.pair1.fastq.gz}.t30l50.single1.fastq.gz \
    ${OUTPUT_DIR}/${FNAME%.64.pair1.fastq.gz}.t30l50.pair2.fastq.gz \
    ${OUTPUT_DIR}/${FNAME%.64.pair1.fastq.gz}.t30l50.single2.fastq.gz \
    TOPHRED33 ILLUMINACLIP:adapters.fa:2:30:15 TRAILING:30 MINLEN:50 \
    2> ${OUTPUT_DIR}/${FNAME%.64.pair1.fastq.gz}.trim.out ;
done

cat reads/normal/run62DVGAAXX_1/normal.trim.out
What does Trimmomatic says it did ? Solution
Exercice: Let’s generate the new graphs Solution
How does it look now ? Solution
Alignment
The raw reads are now cleaned up of artefacts we can align each lane separatly.
Why should this be done separatly? Solution
Why is it important to set Read Group information ? Solution
Alignment with bwa-mem
# Align data
for file in reads/*/run*/*.pair1.fastq.gz;
do
  FNAME=`basename $file`;
  DIR=`dirname $file`;
  OUTPUT_DIR=`echo $DIR | sed 's/reads/alignment/g'`;
  SNAME=`echo $file | sed 's/reads\/\([^/]\+\)\/.*/\1/g'`;
  RUNID=`echo $file | sed 's/.*\/run\([^_]\+\)_.*/\1/g'`;
  LANE=`echo $file | sed 's/.*\/run[^_]\+_\(.\).*/\1/g'`;

  mkdir -p $OUTPUT_DIR;

  bwa mem -M -t 3 \
    -R "@RG\\tID:${SNAME}_${RUNID}_${LANE}\\tSM:${SNAME}\\t\
LB:${SNAME}_${RUNID}\\tPU:${RUNID}_${LANE}\\tCN:Centre National de Genotypage\\tPL:ILLUMINA" \
    ${REF}/genome/bwa_index/Homo_sapiens.GRCh37.fa \
    $file \
    ${file%.pair1.fastq.gz}.pair2.fastq.gz \
  | java -Xmx2G -jar ${GATK_JAR}  SortSam \
    -I /dev/stdin \
    -O ${OUTPUT_DIR}/${SNAME}.sorted.bam \
    --CREATE_INDEX true --SORT_ORDER coordinate --MAX_RECORDS_IN_RAM 500000
done
Why did we pipe the output of one to the other ? Solution
Could we have done it differently ? Solution
Lane merging
We now have alignments for each of the sequences lanes:
- This is not practical in it’s current form.
- What we wan’t to do now is merge the results into one BAM.
Since we identified the reads in the BAM with read groups, even after the merging, we can still identify the origin of each read.
# Merge Data
java -Xmx2G -jar ${GATK_JAR}  MergeSamFiles \
  -I alignment/normal/run62DPDAAXX_8/normal.sorted.bam \
  -I alignment/normal/run62DVGAAXX_1/normal.sorted.bam \
  -I alignment/normal/run62MK3AAXX_5/normal.sorted.bam \
  -I alignment/normal/runA81DF6ABXX_1/normal.sorted.bam \
  -I alignment/normal/runA81DF6ABXX_2/normal.sorted.bam \
  -I alignment/normal/runBC04D4ACXX_2/normal.sorted.bam \
  -I alignment/normal/runBC04D4ACXX_3/normal.sorted.bam \
  -I alignment/normal/runBD06UFACXX_4/normal.sorted.bam \
  -I alignment/normal/runBD06UFACXX_5/normal.sorted.bam \
  -O alignment/normal/normal.sorted.bam \
  --CREATE_INDEX true

java -Xmx2G -jar ${GATK_JAR}  MergeSamFiles \
  -I alignment/tumor/run62DU0AAXX_8/tumor.sorted.bam \
  -I alignment/tumor/run62DUUAAXX_8/tumor.sorted.bam \
  -I alignment/tumor/run62DVMAAXX_4/tumor.sorted.bam \
  -I alignment/tumor/run62DVMAAXX_6/tumor.sorted.bam \
  -I alignment/tumor/run62DVMAAXX_8/tumor.sorted.bam \
  -I alignment/tumor/run62JREAAXX_4/tumor.sorted.bam \
  -I alignment/tumor/run62JREAAXX_6/tumor.sorted.bam \
  -I alignment/tumor/run62JREAAXX_8/tumor.sorted.bam \
  -I alignment/tumor/runAC0756ACXX_5/tumor.sorted.bam \
  -I alignment/tumor/runBD08K8ACXX_1/tumor.sorted.bam \
  -I alignment/tumor/run62DU6AAXX_8/tumor.sorted.bam \
  -I alignment/tumor/run62DUYAAXX_7/tumor.sorted.bam \
  -I alignment/tumor/run62DVMAAXX_5/tumor.sorted.bam \
  -I alignment/tumor/run62DVMAAXX_7/tumor.sorted.bam \
  -I alignment/tumor/run62JREAAXX_3/tumor.sorted.bam \
  -I alignment/tumor/run62JREAAXX_5/tumor.sorted.bam \
  -I alignment/tumor/run62JREAAXX_7/tumor.sorted.bam \
  -I alignment/tumor/runAC0756ACXX_4/tumor.sorted.bam \
  -I alignment/tumor/runAD08C1ACXX_1/tumor.sorted.bam \
  -O alignment/tumor/tumor.sorted.bam \
  --CREATE_INDEX true
You should now have one BAM containing all your data.
Let’s double check
ls -l alignment/normal/
samtools view -H alignment/normal/normal.sorted.bam | grep "^@RG"
You should have your 9 read group entries.
Why did we use the -H switch? Solution
Try without. What happens? Solution
SAM/BAM exploration
Let’s spend some time to explore bam files.
samtools view alignment/normal/normal.sorted.bam | head -n4
Here you have examples of alignment results. A full description of the flags can be found in the SAM specification http://samtools.sourceforge.net/SAM1.pdf
You can try using picards explain flag site to understand what is going on with your reads http://broadinstitute.github.io/picard/explain-flags.html
The flag is the 2nd column.
What do the flags of the first 4th reads mean? solutions
Exercice: Let’s take the 3rd one, the one that is in proper pair, and find it’s mate. solutions
Why the pairing information is important ? solutions
SAM/BAM filtering
You can use samtools to filter reads as well.
Exercice: How many reads mapped and unmapped were there? solution
SAM/BAM CIGAR string
Another useful bit of information in the SAM is the CIGAR string. It’s the 6th column in the file.
This column explains how the alignment was achieved.
    M == base aligns *but doesn't have to be a match*. A SNP will have an M even if it disagrees with the reference.
    I == Insertion
    D == Deletion
    S == soft-clips. These are handy to find un removed adapters, viral insertions, etc.
An in depth explanation of the CIGAR can be found here
The exact details of the cigar string can be found in the SAM spec as well.
We won’t go into too much detail at this point since we want to concentrate on cancer specific issues now.
Cleaning up alignments
We started by cleaning up the raw reads. Now we need to fix some alignments.
The first step for this is to realign around indels and snp dense regions.
The Genome Analysis toolkit has a tool for this called IndelRealigner.
It basically runs in 2 steps:
- Find the targets
- Realign them
##GATK IndelRealigner
# Realign
#switch to old GATK 3.8
module unload  mugqic/GenomeAnalysisTK/4.1.0.0
module load mugqic/GenomeAnalysisTK/3.8

java -Xmx2G  -jar ${GATK_JAR} \
  -T RealignerTargetCreator \
  -R ${REF}/genome/Homo_sapiens.GRCh37.fa \
  -o alignment/normal/realign.intervals \
  -I alignment/normal/normal.sorted.bam \
  -I alignment/tumor/tumor.sorted.bam \
  -L 9

java -Xmx2G -jar ${GATK_JAR} \
  -T IndelRealigner \
  -R ${REF}/genome/Homo_sapiens.GRCh37.fa \
  -targetIntervals alignment/normal/realign.intervals \
  --nWayOut .realigned.bam \
  -I alignment/normal/normal.sorted.bam \
  -I alignment/tumor/tumor.sorted.bam

  mv normal.sorted.realigned.ba* alignment/normal/
  mv tumor.sorted.realigned.ba* alignment/tumor/


#return to GATK 4
module unload mugqic/GenomeAnalysisTK/3.8
module load  mugqic/GenomeAnalysisTK/4.1.0.0
Why did we use both normal and tumor together? Solution
How could we make this go faster ? Solution
How many regions did it think needed cleaning ? Solution
Indel Realigner also makes sure the called deletions are left aligned when there is a microsatellite or homopolymer.
This
ATCGAAAA-TCG
into
ATCG-AAAATCG

or
ATCGATATATATA--TCG
into
ATCG--ATATATATATCG
Why it is important ?Solution
Mark duplicates
What are duplicate reads ? Solution
What are they caused by ? Solution
What are the ways to detect them ? Solution
Here we will use picards approach:
# Mark Duplicates
java -Xmx2G -jar ${GATK_JAR}  MarkDuplicates \
  --REMOVE_DUPLICATES false --CREATE_INDEX true \
  -I alignment/normal/normal.sorted.realigned.bam \
  -O alignment/normal/normal.sorted.dup.bam \
  --METRICS_FILE alignment/normal/normal.sorted.dup.metrics

java -Xmx2G -jar ${GATK_JAR}  MarkDuplicates \
  --REMOVE_DUPLICATES false --CREATE_INDEX=true \
  -I alignment/tumor/tumor.sorted.realigned.bam \
  -O alignment/tumor/tumor.sorted.dup.bam \
  --METRICS_FILE alignment/tumor/tumor.sorted.dup.metrics
We can look in the metrics output to see what happened.
less -S alignment/normal/normal.sorted.dup.metrics
less -S alignment/tumor/tumor.sorted.dup.metrics
How many duplicates were there ? Solution
We can see that it computed separate measures for each library.
Why is this important to do not combine everything ? Solution
Base Quality recalibration
Why do we need to recalibrate base quality scores ? Solution
It runs in 2 steps:
1 - Build covariates based on context and known snp sites
2 - Correct the reads based on these metrics
GATK BaseRecalibrator:
# Recalibrate
for i in normal tumor
do
  java -Xmx2G -jar ${GATK_JAR} BaseRecalibrator \
    -R ${REF}/genome/Homo_sapiens.GRCh37.fa \
    --known-sites ${REF}/annotations/Homo_sapiens.GRCh37.dbSNP150.vcf.gz \
    -L 9:130215000-130636000 \
    -O alignment/${i}/${i}.sorted.dup.recalibration_report.grp \
    -I alignment/${i}/${i}.sorted.dup.bam

    java -Xmx2G -jar ${GATK_JAR} ApplyBQSR \
      -R ${REF}/genome/Homo_sapiens.GRCh37.fa \
      -bqsr alignment/${i}/${i}.sorted.dup.recalibration_report.grp \
      -O alignment/${i}/${i}.sorted.dup.recal.bam \
      -I alignment/${i}/${i}.sorted.dup.bam
done
Extract BAM metrics
Once your whole bam is generated, it’s always a good thing to check the data again to see if everything makes sense.
Compute coverage If you have data from a capture kit, you should see how well your targets worked
Insert Size It tells you if your library worked
Alignment metrics It tells you if your sample and you reference fit together
Compute coverage
Both GATK and BVATools have depth of coverage tools.
Here we’ll use the GATK one
# Get Depth
#switch to old GATK 3.8
module unload  mugqic/GenomeAnalysisTK/4.1.0.0
module load mugqic/GenomeAnalysisTK/3.8

for i in normal tumor
do
  java  -Xmx2G -jar ${GATK_JAR} \
    -T DepthOfCoverage \
    --omitDepthOutputAtEachBase \
    --summaryCoverageThreshold 10 \
    --summaryCoverageThreshold 25 \
    --summaryCoverageThreshold 50 \
    --summaryCoverageThreshold 100 \
    --start 1 --stop 500 --nBins 499 -dt NONE \
    -R ${REF}/genome/Homo_sapiens.GRCh37.fa \
    -o alignment/${i}/${i}.sorted.dup.recal.coverage \
    -I alignment/${i}/${i}.sorted.dup.recal.bam \
    -L 9:130215000-130636000
done

#return to GATK 4
module unload mugqic/GenomeAnalysisTK/3.8
module load  mugqic/GenomeAnalysisTK/4.1.0.0
note on DepthOfCoverage command
Coverage is the expected ~50x in this project
Look at the coverage:
cat alignment/normal/normal.sorted.dup.recal.coverage.sample_interval_summary
cat alignment/tumor/tumor.sorted.dup.recal.coverage.sample_interval_summary
Is the coverage fit with the expectation ? solution
Insert Size
It corresponds to the size of DNA fragments sequenced.
Different from the gap size (= distance between reads) !
These metrics are computed using Picard:
# Get insert size
for i in normal tumor
do
  java -Xmx2G -jar ${GATK_JAR}  CollectInsertSizeMetrics \
    -R ${REF}/genome/Homo_sapiens.GRCh37.fa \
    -I alignment/${i}/${i}.sorted.dup.recal.bam \
    -O alignment/${i}/${i}.sorted.dup.recal.metric.insertSize.tsv \
    -H alignment/${i}/${i}.sorted.dup.recal.metric.insertSize.histo.pdf \
    --METRIC_ACCUMULATION_LEVEL LIBRARY
done
look at the output
head -20 alignment/normal/normal.sorted.dup.recal.metric.insertSize.tsv
head -20 alignment/tumor/tumor.sorted.dup.recal.metric.insertSize.tsv
There is something interesting going on with our libraries.
Can you tell what it is? Solution
Which library is the most suitable for cancer analysis ? Solution
Alignment metrics
For the alignment metrics, samtools flagstat is very fast but with bwa-mem since some reads get broken into pieces, the numbers are a bit confusing.
We prefer the Picard way of computing metrics:
# Get alignment metrics
for i in normal tumor
do
  java -Xmx2G -jar ${GATK_JAR}  CollectAlignmentSummaryMetrics \
    -R ${REF}/genome/Homo_sapiens.GRCh37.fa \
    -I alignment/${i}/${i}.sorted.dup.recal.bam \
    -O alignment/${i}/${i}.sorted.dup.recal.metric.alignment.tsv \
    --METRIC_ACCUMULATION_LEVEL LIBRARY
done
explore the results
less -S alignment/normal/normal.sorted.dup.recal.metric.alignment.tsv
less -S alignment/tumor/tumor.sorted.dup.recal.metric.alignment.tsv
Do you think the sample and the reference genome fit together ? Solution
Exit the container environment
exit
Aknowledgments
I would like to thank and acknowledge Pierre-Olivier Quirion, Robert Eveleigh, Edouard Henrion for their inputs while building this workshop.