High-throughput Biology - From Sequence to Networks 2019 - Lab 3
This work is licensed under a Creative Commons Attribution-ShareAlike 3.0 Unported License. This means that you are able to copy, share and modify the work, as long as the result is distributed under the same license.
CSHL-CBW HT-Bio Module 3 - Genome Alignment
by Mathieu Bourgey, Ph.D
Introduction
This workshop will show you how to launch individual first steps of a DNA-Seq pipeline
We will be working on a 1000 genome sample, NA12878. You can find the whole raw data on the 1000 genome website: http://www.1000genomes.org/data
NA12878 is the child of the trio while NA12891 and NA12892 are her parents.
| Mother | Father | Child |
|---|---|---|
| NA12892 | NA12891 | NA12878 |
If you finish early, feel free to perform the same steps on the other two individuals: NA12891 & NA12892.
For practical reasons we subsampled the reads from the sample because running the whole dataset would take way too much time and resources. We’re going to focus on the reads extracted from a 300 kbp stretch of chromosome 1
| Chromosome | Start | End |
|---|---|---|
| chr1 | 17704860 | 18004860 |
Original Setup
Amazon node
Read these directions for information on how to log in to your assigned Amazon node.
Software requirements
These are all already installed, but here are the original links.
Environment setup
#set up
export WORK_DIR=~/workspace/HTseq/Module3/
export REF=$WORK_DIR/reference/


rm -rf $WORK_DIR
mkdir -p $WORK_DIR
cd $WORK_DIR
ln -s ~/CourseData/CG_data/HT_data/Module3/* .

singularity run -B ~/cvmfs_cache:/cvmfs-cache/ docker://c3genomics/genpipes:0.7  -V 3.1.2
module load mugqic/java/openjdk-jdk1.8.0_72 mugqic/bvatools/1.6 mugqic/trimmomatic/0.36 mugqic/samtools/1.9 mugqic/bwa/0.7.17 mugqic/GenomeAnalysisTK/4.1.0.0 mugqic/R_Bioconductor/3.5.0_3.7
Data files
The initial structure of your folders should look like this:
ROOT
|-- raw_reads/               # fastqs from the center (down sampled)
    `-- NA12878/             # Child sample directory
    `-- NA12891/             # Father sample directory
    `-- NA12892/             # Mother sample directory
`-- reference/               # hg19 reference and indexes
`-- scripts/                 # command lines scripts
`-- saved_results/           # precomputed final files
Cheat sheets
First data glance
So you’ve just received an email saying that your data is ready for download from the sequencing center of your choice.
What should you do? solution
Fastq files
Let’s first explore the fastq file.
Try these commands
zless -S raw_reads/NA12878/NA12878_CBW_chr1_R1.fastq.gz
These are fastq file.
Could you descride the fastq format? Solution
zcat raw_reads/NA12878/NA12878_CBW_chr1_R1.fastq.gz | head -n4
zcat raw_reads/NA12878/NA12878_CBW_chr1_R2.fastq.gz | head -n4
What was special about the output and why was it like that? solution
You could also count the reads
zgrep -c "^@SN1114" raw_reads/NA12878/NA12878_CBW_chr1_R1.fastq.gz
We found 56512 reads
Why shouldn’t you just do?
zgrep -c "^@" raw_reads/NA12878/NA12878_CBW_chr1_R1.fastq.gz
Quality
We can’t look at all the reads. Especially when working with whole genome 30x data. You could easilly have Billions of reads.
Tools like FastQC and BVATools readsqc can be used to plot many metrics from these data sets.
Let’s look at the data:
mkdir -p originalQC/
java -Xmx1G -jar ${BVATOOLS_JAR} readsqc \
  --read1 raw_reads/NA12878/NA12878_CBW_chr1_R1.fastq.gz \
  --read2 raw_reads/NA12878/NA12878_CBW_chr1_R2.fastq.gz \
  --threads 2 --regionName ACTL8 --output originalQC/
open a web browser on your laptop, and navigate to http://XX.oicrcbw.ca, where XX is the id of your node. You should be able to find there the directory hierarchy under ~/HTseq/Module3/ on your node. open originalQC folder and open the images.
What stands out in the graphs?
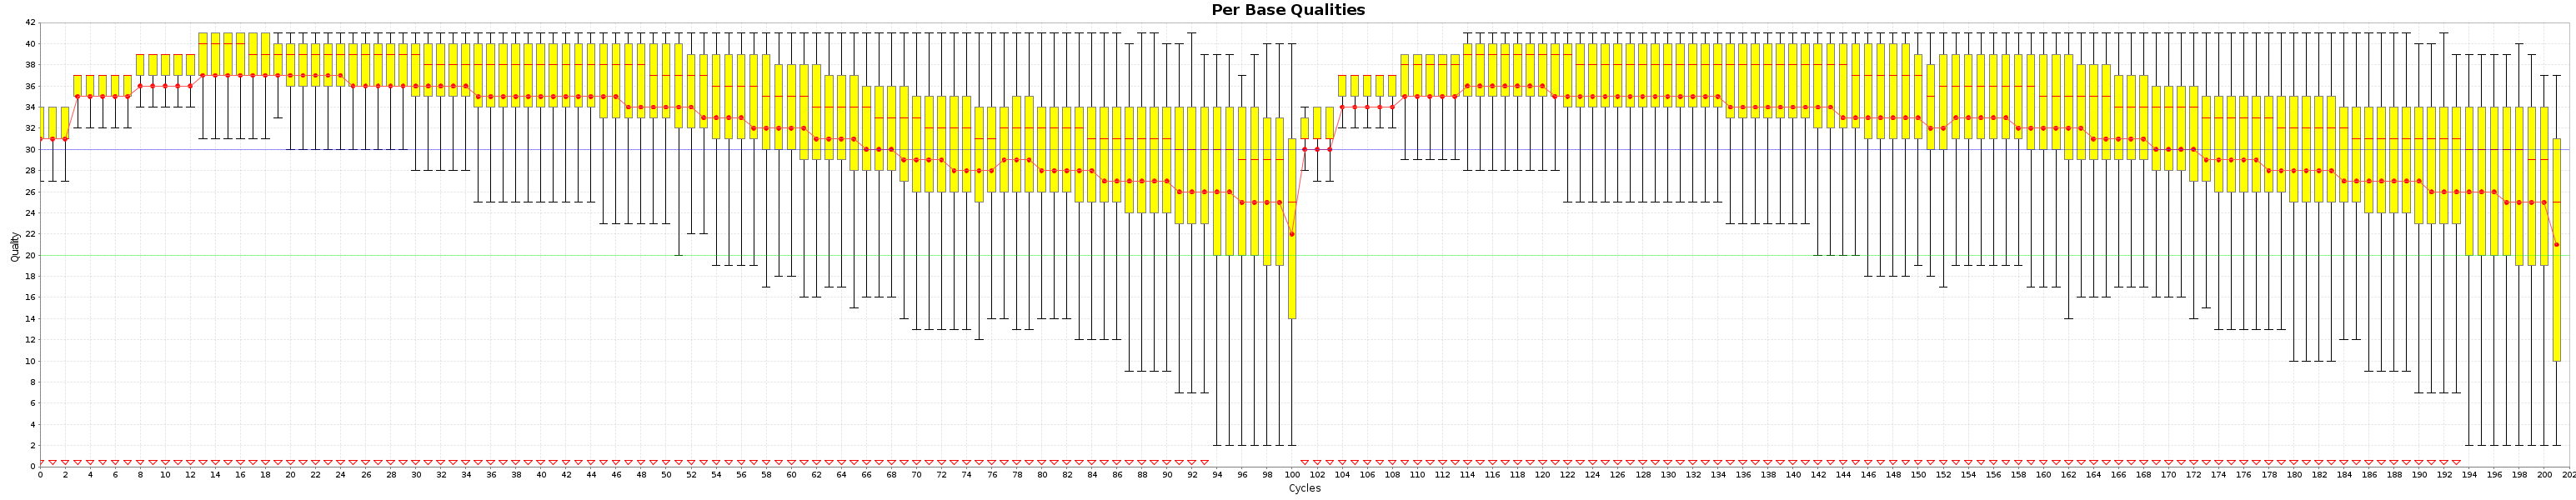
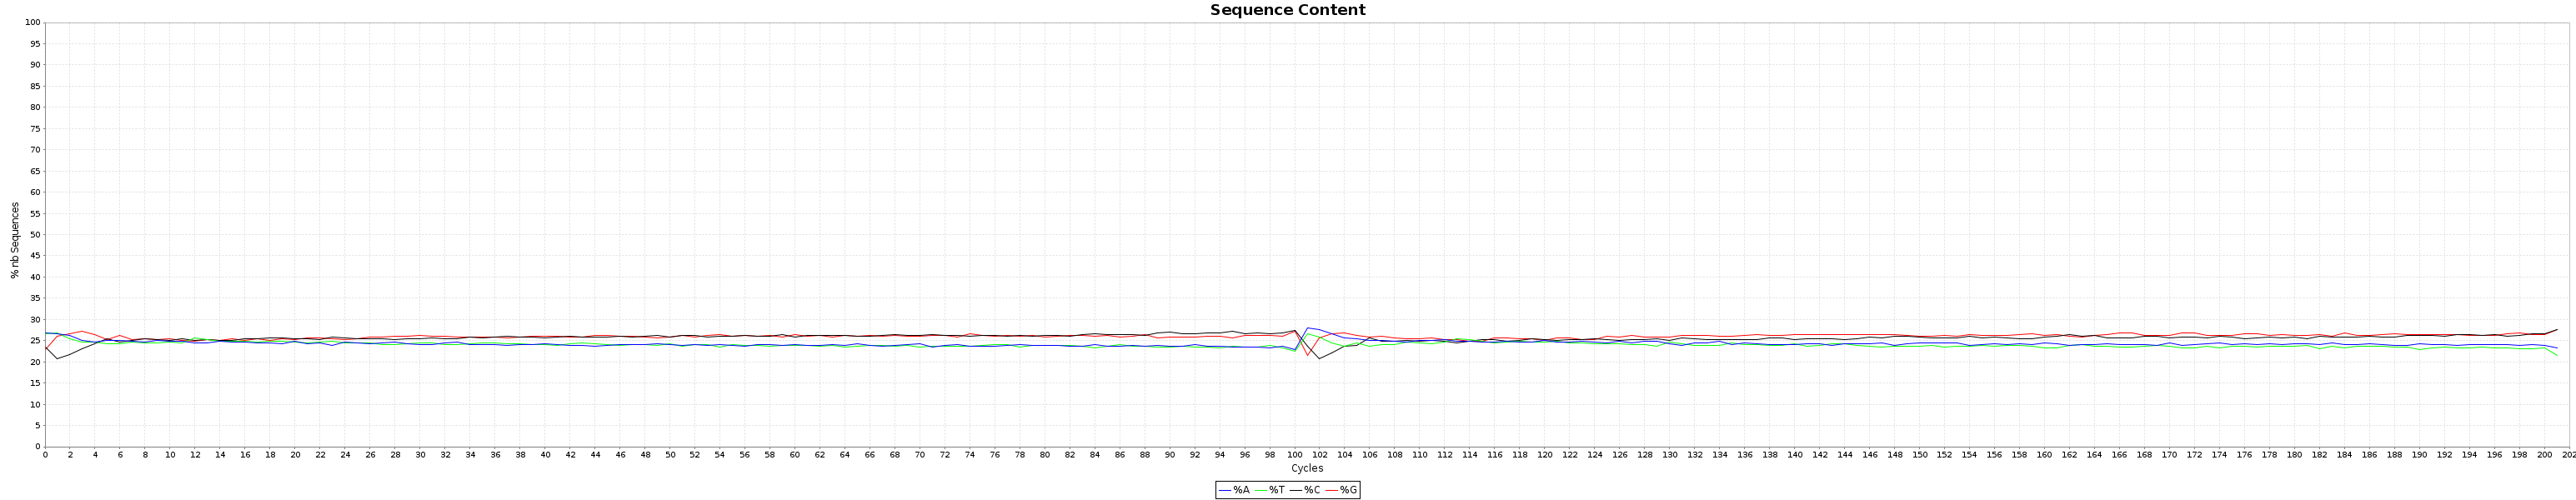
All the generated graphics have their uses. This being said, 2 of them are particularly useful to get an overal picture of how good or bad a run went.
These are the Quality box plots
and the nucleotide content graphs.
The Box plot shows the quality distribution of your data. The Graph goes > 100 because both ends are appended one after the other.
The quality of a base is computated using the Phread quality score.
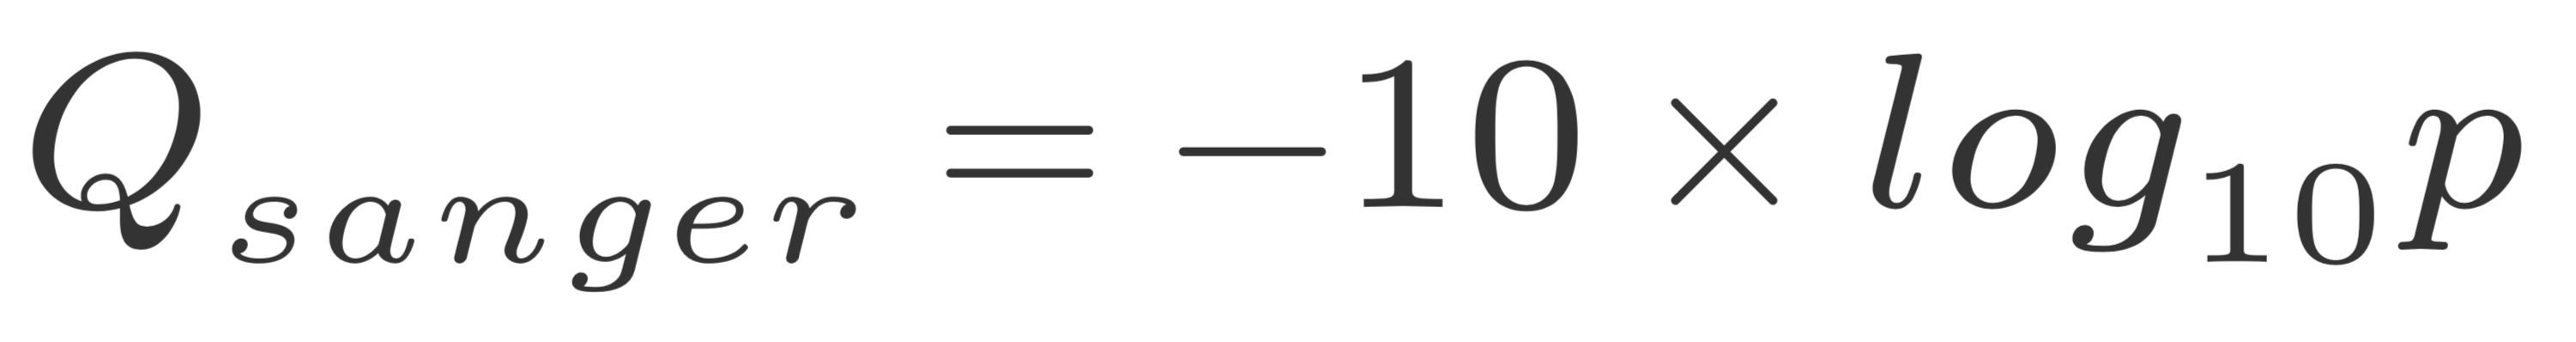
The formula outputs an integer that is encoded using an ASCII table.
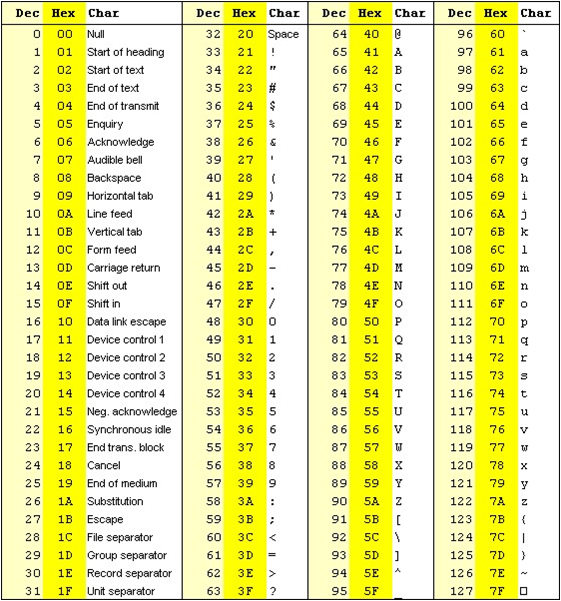
The way the lookup is done is by taking the the phred score adding 33 and using this number as a lookup in the table. The Wikipedia entry for the FASTQ format has a summary of the varying values.
Older illumina runs were using phred+64 instead of phred+33 to encode their fastq files.
Trimming
After this careful analysis of the raw data we see that
- Some reads have bad 3’ ends.
- no read has adapter sequences in it.
Although nowadays this doesn’t happen often, it does still happen. In some cases, miRNA, it is expected to have adapters. Since they are not part of the genome of interest they should be removed if enough reads have them.
To be able to remove adapters and low qualtity bases, we will use Trimmomatic.
The adapter file is already in your reference folder.
We can look at the adapters
cat $REF/adapters.fa
Why are there 2 different ones ? solution
Let’s try removing them and see what happens.
mkdir -p reads/NA12878/

java -Xmx2G -cp $TRIMMOMATIC_JAR org.usadellab.trimmomatic.TrimmomaticPE -threads 2 -phred33 \
  raw_reads/NA12878/NA12878_CBW_chr1_R1.fastq.gz \
  raw_reads/NA12878/NA12878_CBW_chr1_R2.fastq.gz \
  reads/NA12878/NA12878_CBW_chr1_R1.t20l32.fastq.gz \
  reads/NA12878/NA12878_CBW_chr1_S1.t20l32.fastq.gz \
  reads/NA12878/NA12878_CBW_chr1_R2.t20l32.fastq.gz \
  reads/NA12878/NA12878_CBW_chr1_S2.t20l32.fastq.gz \
  ILLUMINACLIP:${REF}/adapters.fa:2:30:15 TRAILING:20 MINLEN:32 \
  2> reads/NA12878/NA12878.trim.out

cat reads/NA12878/NA12878.trim.out
What does Trimmomatic says it did ? solution
Let’s look at the graphs now
mkdir -p postTrimQC/
java -Xmx1G -jar ${BVATOOLS_JAR} readsqc \
  --read1 reads/NA12878/NA12878_CBW_chr1_R1.t20l32.fastq.gz \
  --read2 reads/NA12878/NA12878_CBW_chr1_R2.t20l32.fastq.gz \
  --threads 2 --regionName ACTL8 --output postTrimQC/
How does it look now? solution
Could we have done a better job? solution
Alignment
The raw reads are now cleaned up of artefacts we can align the read to the reference.
In case you have multiple readsets or library you should align them separatly !
Why should this be done separatly? solution
mkdir -p alignment/NA12878/

bwa mem -M -t 2 \
  -R '@RG\tID:NA12878\tSM:NA12878\tLB:NA12878\tPU:runNA12878_1\tCN:Broad Institute\tPL:ILLUMINA' \
  ${REF}/hg19.fa \
  reads/NA12878/NA12878_CBW_chr1_R1.t20l32.fastq.gz \
  reads/NA12878/NA12878_CBW_chr1_R2.t20l32.fastq.gz \
  | java -Xmx2G -jar ${GATK_JAR} SortSam \
  -I /dev/stdin \
  -O alignment/NA12878/NA12878.sorted.bam \
  -SO coordinate \
  --CREATE_INDEX true --MAX_RECORDS_IN_RAM 500000
Why is it important to set Read Group information? solution
The details of the fields can be found in the SAM/BAM specifications Here For most cases, only the sample name, platform unit and library one are important.
Why did we pipe the output of one to the other? Could we have done it differently? solution
Lane merging (optional)
In case ywe generate multiple lane of sequencing or mutliple library. It is not practical to keep the data splited and all the reads should be merge into one massive file.
Since we identified the reads in the BAM with read groups, even after the merging, we can still identify the origin of each read.
SAM/BAM
Let’s spend some time to explore bam files.
try
samtools view alignment/NA12878/NA12878.sorted.bam | head -n4
Here you have examples of alignment results. A full description of the flags can be found in the SAM specification
Try using picards explain flag site to understand what is going on with your reads
The flag is the 2nd column.
What do the flags of the first 4 reads mean? solution
Let’s take the 3nd one and find it’s pair.
try
samtools view alignment/NA12878/NA12878.sorted.bam | grep "1313:19317:61840"
Why did searching one name find both reads? solution
You can use samtools to filter reads as well.
# Say you want to count the *un-aligned* reads, you can use
samtools view -c -f4 alignment/NA12878/NA12878.sorted.bam

# Or you want to count the *aligned* reads you, can use
samtools view -c -F4 alignment/NA12878/NA12878.sorted.bam
How many reads mapped and unmapped were there? solution
Another useful bit of information in the SAM is the CIGAR string. It’s the 6th column in the file. This column explains how the alignment was achieved.
- M == base aligns but doesn’t have to be a match. A SNP will have an M even if it disagrees with the reference.
- I == Insertion
- D == Deletion
- S == soft-clips. These are handy to find un removed adapters, viral insertions, etc.
An in depth explanation of the CIGAR can be found here The exact details of the cigar string can be found in the SAM spec as well. Another good site
Cleaning up alignments
We started by cleaning up the raw reads. Now we need to fix and clean some alignments.
Indel realignment
The first step for this is to realign around indels and snp dense regions. The Genome Analysis toolkit has a tool for this called IndelRealigner.
It basically runs in 2 steps
1- Find the targets 2- Realign them.
#switch to old GATK 3.8
module unload  mugqic/GenomeAnalysisTK/4.1.0.0
module load mugqic/GenomeAnalysisTK/3.8

java -Xmx2G  -jar ${GATK_JAR} \
  -T RealignerTargetCreator \
  -R ${REF}/hg19.fa \
  -o alignment/NA12878/realign.intervals \
  -I alignment/NA12878/NA12878.sorted.bam \
  -L chr1

java -Xmx2G -jar ${GATK_JAR} \
  -T IndelRealigner \
  -R ${REF}/hg19.fa \
  -targetIntervals alignment/NA12878/realign.intervals \
  -o alignment/NA12878/NA12878.realigned.sorted.bam \
  -I alignment/NA12878/NA12878.sorted.bam

#return to GATK 4
module unload mugqic/GenomeAnalysisTK/3.8
module load  mugqic/GenomeAnalysisTK/4.1.0.0
How could we make this go faster? solution
How many regions did it think needed cleaning? solution
Mark duplicates
As the step says, this is to mark duplicate reads.
What are duplicate reads ? solution
What are they caused by ? solution
What are the ways to detect them ? solution
Here we will use the GATK approach:
java -Xmx2G -jar ${GATK_JAR} MarkDuplicates \
  --REMOVE_DUPLICATES false --CREATE_INDEX true \
  -I alignment/NA12878/NA12878.realigned.sorted.bam \
  -O alignment/NA12878/NA12878.sorted.dup.bam \
  --METRICS_FILE=alignment/NA12878/NA12878.sorted.dup.metrics
We can look in the metrics output to see what happened.
less alignment/NA12878/NA12878.sorted.dup.metrics
How many duplicates were there ? solution
This is very low, we expect in general <2%.
Note it computed the metrics for each library.
Why is this important to do it by library and not to combine everything ? solution
Recalibration
This is the last BAM cleaning up step.
The goal for this step is to try to recalibrate base quality scores. The vendors tend to inflate the values of the bases in the reads. Also, this step tries to lower the scores of some biased motifs for some technologies.
It runs in 2 steps, 1- Build covariates based on context and known snp sites 2- Correct the reads based on these metrics
java -Xmx2G -jar ${GATK_JAR} BaseRecalibrator \
  -R ${REF}/hg19.fa \
  --known-sites ${REF}/dbSNP_135_chr1.vcf.gz \
  -L chr1:17704860-18004860 \
  -O alignment/NA12878/NA12878.sorted.dup.recalibration_report.grp \
  -I alignment/NA12878/NA12878.sorted.dup.bam

java -Xmx2G -jar ${GATK_JAR} ApplyBQSR \
  -R ${REF}/hg19.fa \
  -bqsr alignment/NA12878/NA12878.sorted.dup.recalibration_report.grp \
  -O alignment/NA12878/NA12878.sorted.dup.recal.bam \
  -I alignment/NA12878/NA12878.sorted.dup.bam
Extract Metrics
Once your whole bam is generated, it’s always a good thing to check the data again to see if everything makes sens.
Compute coverage
If you have data from a capture kit, you should see how well your targets worked
Both GATK and BVATools have depth of coverage tools. We wrote our own in BVAtools because
- GATK was deprecating theirs
- GATK’s is very slow
- We were missing some output that we wanted from the GATK’s one (GC per interval, valid pairs, etc)
Here we’ll use the GATK one
#switch to old GATK 3.8
module unload  mugqic/GenomeAnalysisTK/4.1.0.0
module load mugqic/GenomeAnalysisTK/3.8

java  -Xmx2G -jar ${GATK_JAR} \
  -T DepthOfCoverage \
  --omitDepthOutputAtEachBase \
  --summaryCoverageThreshold 10 \
  --summaryCoverageThreshold 25 \
  --summaryCoverageThreshold 50 \
  --summaryCoverageThreshold 100 \
  --start 1 --stop 500 --nBins 499 -dt NONE \
  -R ${REF}/hg19.fa \
  -o alignment/NA12878/NA12878.sorted.dup.recal.coverage \
  -I alignment/NA12878/NA12878.sorted.dup.recal.bam \
  -L chr1:17700000-18100000

#return to GATK 4
module unload mugqic/GenomeAnalysisTK/3.8
module load  mugqic/GenomeAnalysisTK/4.1.0.0

#### Look at the coverage
less -S alignment/NA12878/NA12878.sorted.dup.recal.coverage.sample_interval_summary
Coverage is the expected ~30x.
summaryCoverageThreshold is a usefull function to see if your coverage is uniform. Another way is to compare the mean to the median. If both are almost equal, your coverage is pretty flat. If both are quite different, that means something is wrong in your coverage. A mix of WGS and WES would show very different mean and median values.
Insert Size
java -Xmx2G -jar ${GATK_JAR} CollectInsertSizeMetrics \
  -R ${REF}/hg19.fa \
  -I alignment/NA12878/NA12878.sorted.dup.recal.bam \
  -O alignment/NA12878/NA12878.sorted.dup.recal.metric.insertSize.tsv \
  -H alignment/NA12878/NA12878.sorted.dup.recal.metric.insertSize.histo.pdf \
  --METRIC_ACCUMULATION_LEVEL LIBRARY

#look at the output
less -S alignment/NA12878/NA12878.sorted.dup.recal.metric.insertSize.tsv
What is the insert size and the corresponding standard deviation ? solution
Is the insert-size important ? solution
Alignment metrics
For the alignment metrics, we used to use samtools flagstat but with bwa mem since some reads get broken into pieces, the numbers are a bit confusing.
You can try it if you want.
We prefer the GATK way of computing metrics
java -Xmx2G -jar ${GATK_JAR} CollectAlignmentSummaryMetrics \
  -R ${REF}/hg19.fa \
  -I alignment/NA12878/NA12878.sorted.dup.recal.bam \
  -O alignment/NA12878/NA12878.sorted.dup.recal.metric.alignment.tsv \
  --METRIC_ACCUMULATION_LEVEL LIBRARY

#### explore the results

less -S alignment/NA12878/NA12878.sorted.dup.recal.metric.alignment.tsv
What is the percent of aligned reads ? solution
quit the singularity container Environment
exit
Summary
In this lab, we aligned reads from the sample NA12878 to the reference genome hg19:
- We became familiar with FASTQ and SAM/BAM formats.
- We checked read QC with BVAtools.
- We trimmed unreliable bases from the read ends using Trimmomatic.
- We aligned the reads to the reference using BWA.
- We sorted the alignments by chromosome position using GATK.
- We realigned short indels using GATK.
- We fixed mate issues using GATK.
- We recalibrate the Base Quality using GATK.
- We generate alignment metrics using GATK.
Papers of Interest
Best practices for benchmarking germline small-variant calls in human genomes Nature Biotechnology https://t.co/VW0x24Jsc6