Genomic Medicine 2018 Module 5 Lab
Module 5: Available Epigenomics Data and Resources
by Guillaume Bourque, PhD
Introduction
Description of the lab
In this module’s lab, we will explore some of the tools that were covered in the lecture.
- First, we will learn how to use the IHEC Data Portal’s tools to fetch datasets of interest.
- Second, we will explore the ENCODE Data Portal.
- Third, we will explore the GTEx Data Portal.
Local software that we will use
- A web browser
Tutorial
1- IHEC Data Portal
Exploring available datasets
-
Open a web browser on your computer, and load the URL http://epigenomesportal.ca/ihec .
-
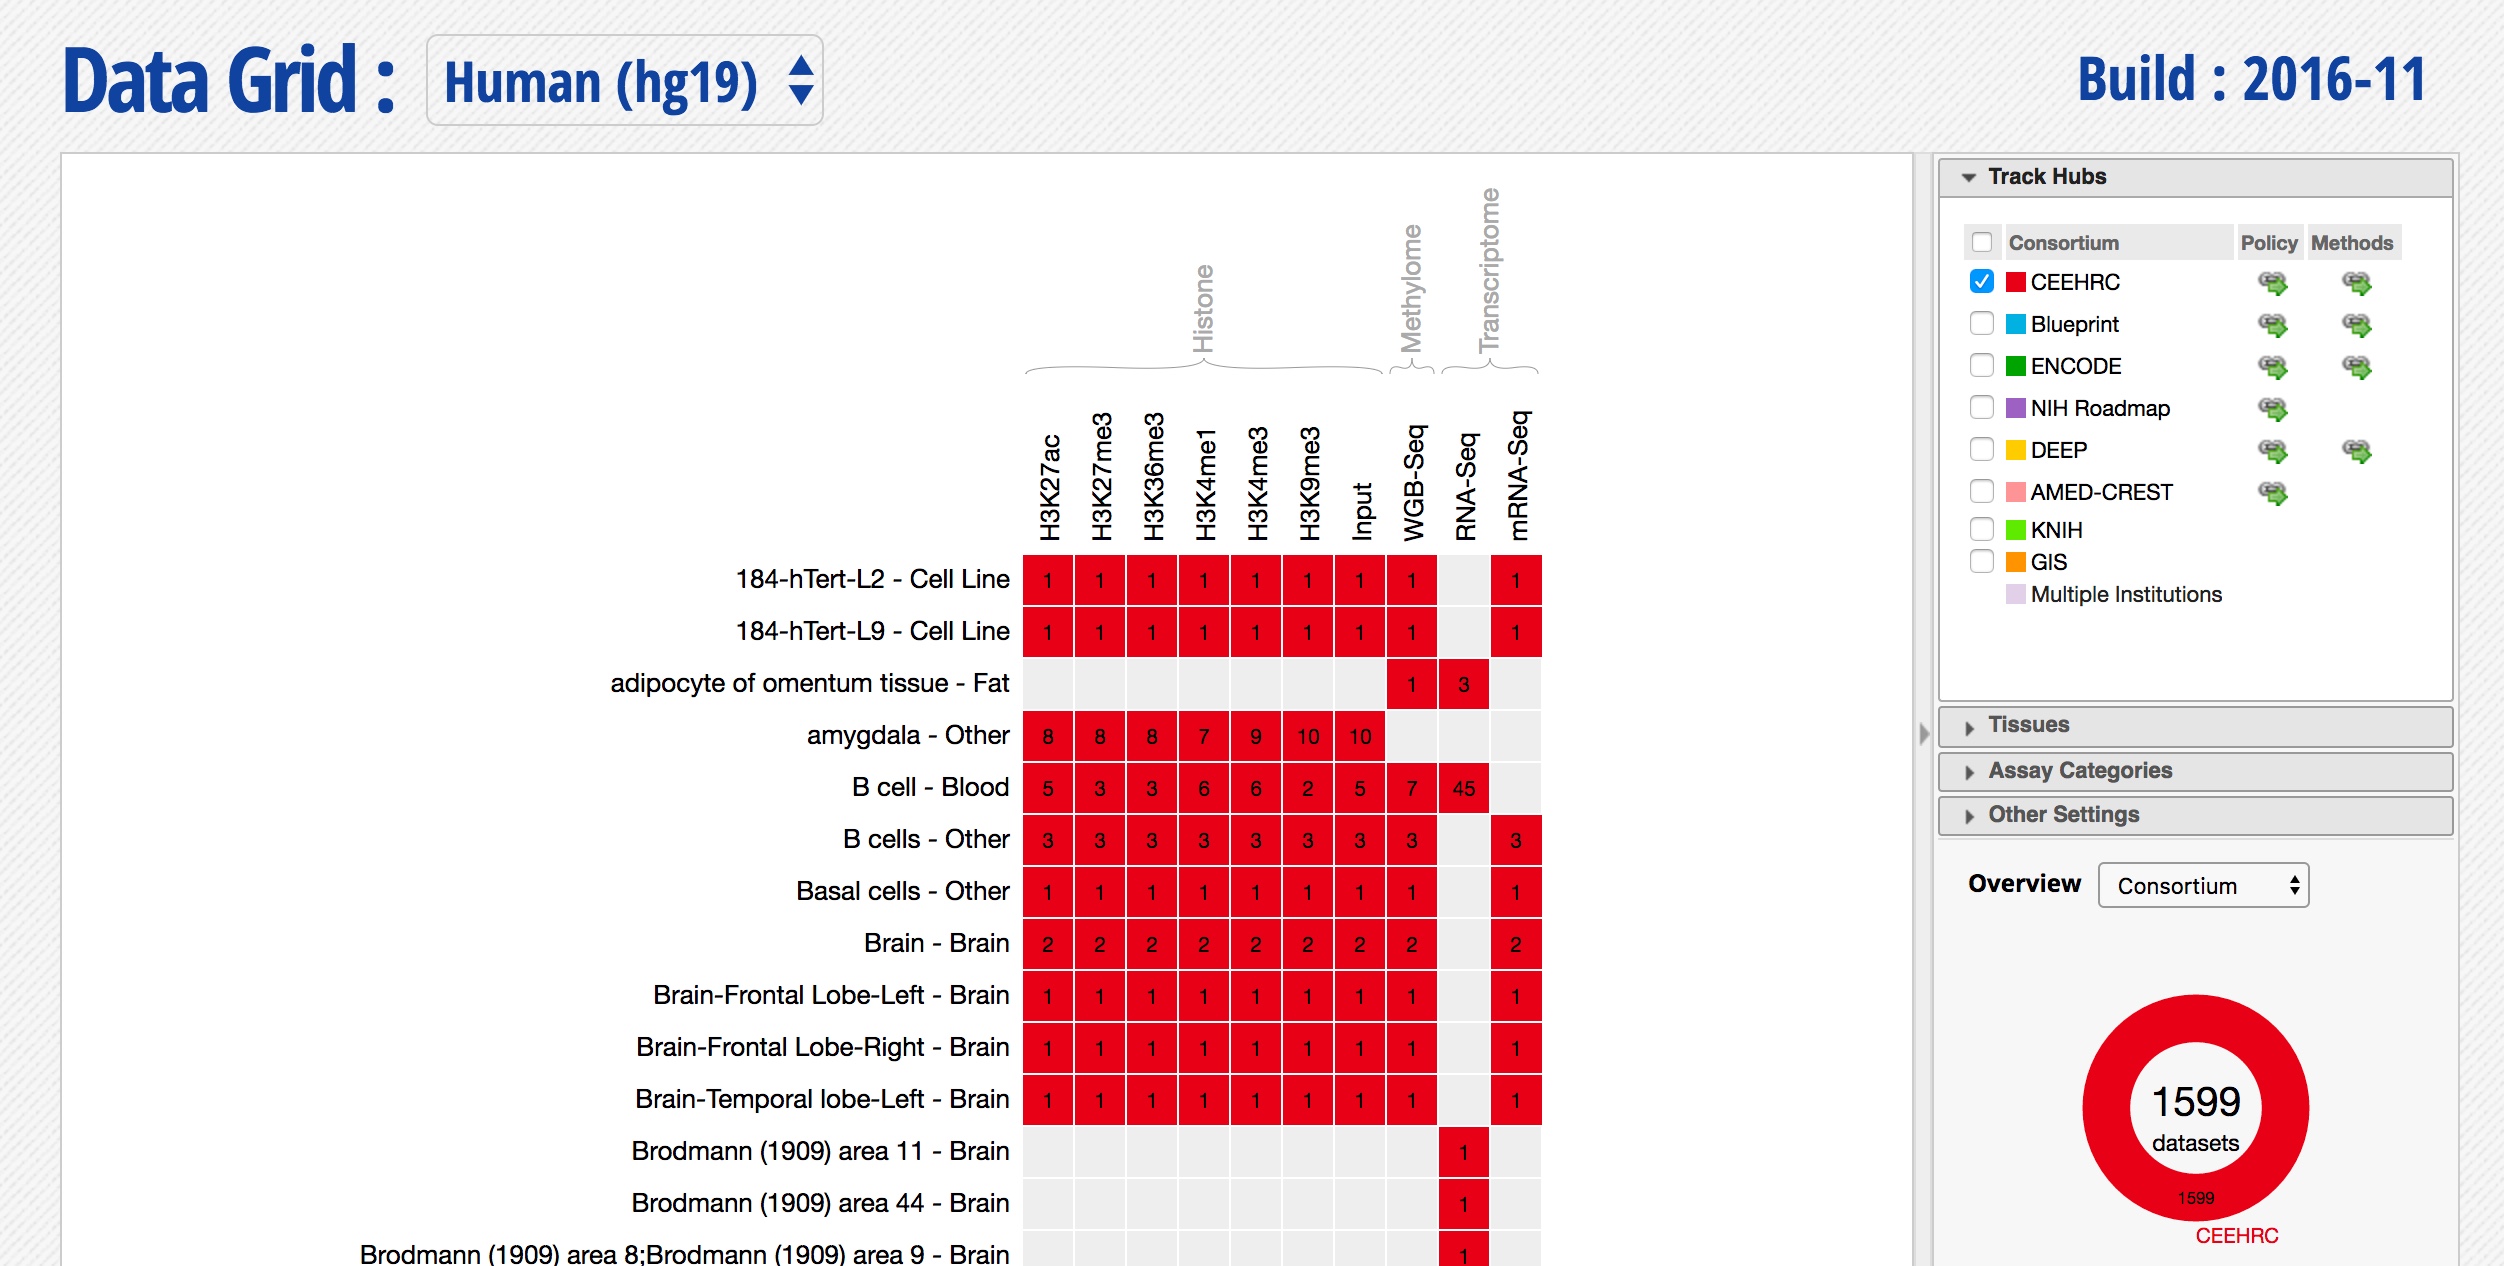
In the Overview page, click on the “View all” button.
- You will get a grid with all available datasets for IHEC Core Assays.
- You can filter visible datasets in the grid using the filtering options on the right side of the grid.
- Select only the datasets coming from the CEEHRC consortium, you should see something like this:
-
Explore the various filtering options on the right, is there a way to restrict this list to your tissue of interest?
-
Can you search and find your favorite cell type? What type of datasets are available?
Visualizing the tracks
-
Go back to selecting only the datasets coming from the CEEHRC consortium
-
Select the 8 H3K27ac ChIP-seq datasets in B cells - Other
-
Select the 4 mRNA-seq datasets in the same cell type
- Click on the button Visualize in Genome Browser just below the grid
- You can see that the datasets are being displayed at a mirror of the UCSC Genome Browser. These are all peaks and signal for the chosen H3K27ac ChIP-Seq and RNA-seq datasets.
-
Now, type in the name of the gene CD79A (a gene expressed in B cells)
-
In the Genome Browser, expand the ChIP-seq tracks and RNA-seq tracks by changing visibility from “pack” to “full” and clicking the “Refresh” button.
-
Zoom out 10X, do you see the potential regulatory regions around this genes?
-
You should get something like this: Solution
- Can you find another gene expressed in B cells?
Tracks correlation
You can get a whole genome overview of the similarity of a group of tracks by using the Portal’s correlation tool.
-
Select 3 RNA-seq datasets in Adipocyte of omentum tissue
-
Select 3 RNA-seq datasets in induced pluripotent stem cells
-
Click on the button Correlate datasets just below the grid, you should see something like:
- Can you find an outlier/bad dataset?
- Under Blood cell-type, try correlating the 8 B-cell with the 4 T-cell H3K27ac datasets
Download tracks or metadata
You can also download these tracks locally for visualization or further analysis, or view the metadata.
- Go back to the IHEC Data Portal tab.
- Click on the Download tracks button at the bottom of the grid.
- Use the download links to download a few of the tracks.
- What about the raw data?
- Go back to the IHEC Data Portal tab.
- Click on the Get metadata button at the bottom of the grid.
Permanent session
Finally, you can create a permanent session corresponding to your current selection of datasets
- Go back to the IHEC Data Portal tab.
- Make a selection of datasets and click on the Save session button at the bottom of the grid.
- You now have a nicer and permanent view of the data that you have selected
- You can use this ID and associated web address (e.g. http://epigenomesportal.ca/ihec/IHECDP00000092) and share it with your collaborators or in a publication
- A permanent session also has links to all the raw datasets
- Is is as easy that access that data? Why?
2- ENCODE Data Portal
- Go to https://www.encodeproject.org/
- So much data! Can you find which human cell type has the most ChIP-seq datasets?
- Explore the different ways you can dynamically filter the data
- Can you also find RNA-seq data in B cells?
3- GTEx Data Portal
- Go to https://www.gtexportal.org
- How many datasets are available?
- Look for the gene CD79A, it’s expressed in how many tissues? Solution
- How many isoforms are expressed?
- Can you find a genetic variant that is associated with CD79A expression levels?
- Can you find a gene that’s diffentially expressed based on gender? Try a famous gene on the X chromsome…
- What about a gene with the reverse pattern?
Congrats, you’re done!
Acknowledgements
Part of this module was developped by David Bujold, who also developped the IHEC Data Portal.