Informatics and Statistics for Metabolomics 2020
Welcome
[Welcome] to Informatics and Statistics for Metabolomics 2020.
The course schedule can be found here
Meet your faculty! here
Pre-Workshop Materials
Pre-workshop Lecture
Pre-readings and pre-work can be found here here.
It is in your best interest to complete these before the workshop.
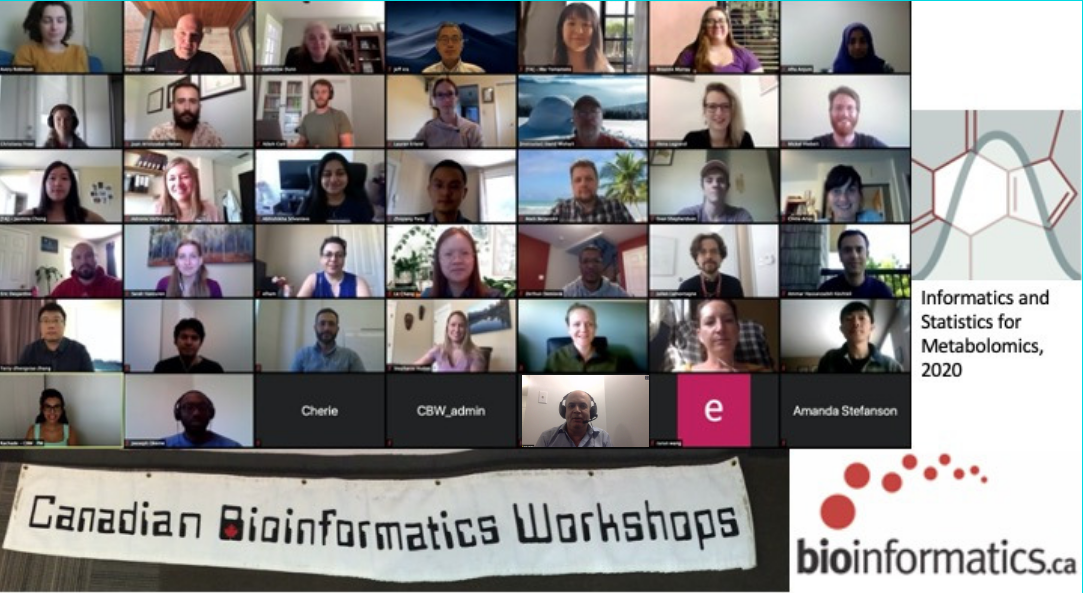
Class Photo

Day 1
Welcome
Rachade Hmamouchi
Module 1: Introduction to Metabolomics
David Wishart
Access Module 1’s lecture here.
Module 2: Metabolite Identification and Annotation
David Wishart
Access Module 2’s lecture slides here —- Updated slides here
## Module 2 LAB: Metabolite Identification and Annotation
Access Module 2’s lab practical slides here —- Updated slides here
Follow the instructions for Module 2’s lab here
Briefly, the lab will go over the following pre-processing workflows:
-
NMR and Bayesil.
-
GC-MS and GC-Autofit.
-
LC-MS and MetaboAnalyst.
Data Set and Results Files:
NMR (Bayesil):
Example datasets (zipped files) for Lab2
- a reduced data set to run during the lab CBW_NMR_Data.zip
- optional, could be run after the lab 8-spectra dataset
- Bayesil profiling results that could be used to generate input for Metaboanalyst CBW_NMR_result
- The 40-spectra dataset that were used to obtain the results above CBW_NMR_full
GCMS (GC-Autofit):
Example datasets (mzXML.zip files)
Download this file: GC_autofit.zip
LC-MS (MetaboAnalyst):
Example datasets (mzXML.zip files)
Download this file: ibd_data_cbw2020_updated.zip
Spectra processing with MetaboAnalyst (example result files)
- Finished MetaboAnalyst spectral processing job
Links:
- MetaboMiner
- rNMR
- BMRB Peaks Server
- BATMAN
- Bayesil
- Golm Database
- NIST/AMDIS
- CFM-ID
- Metlin
- MetFusion
- Adduct Table
- MZedDB
- MWTWIN
- HighChem
- 7GR Software
- MyCompoundID
Module 3: Databases for Chemical, Spectral, and Biological Data
David Wishart
Access Module 3’s lecture here
Links:
- HMDB
- DrugBank
- METLIN
- PubChem
- ChEBI
- ChemSpider
- SDBS
- BioMagResBank
- MMCD
- MassBank
- BMRB
- NMRShiftDB
- SMPDB
- KEGG
- Reactome
- BioCyc
(Optional) Lab Practical: Spectral Processing and Functional Analysis with MetaboAnalyst(R)
Jeff Xia
This dataset was acquired using an UPLC-Q/E-ESI- in negative ionization mode. The 10 samples (per group) are a subset of a much larger study from Lloyd-Price et al., and include fecal samples from patients with Crohn’s Disease (CD, 4), healthy controls (4), and two quality controls. The metadata contains more sample information. Using the MetaboAnalyst web service or MetaboAnalystR, process one of the example datasets below.
Full Metadata here
Larger example datasets (mzXML.zip files) (Optional!! Intended only for Monday’s evening session)
Download example data here
Following spectra processing, use the lab practical and follow Protocol 9 on the resulting peak table to gain functional insights from the untargeted metabolomics data.
Day 2
Module 4: Backgrounder in Statistics
Jeff Xia
Access Module 4’s lecture here — Updated slides here
Module 5: MetaboAnalyst
Jeff Xia
Access Module 5’s lecture here
To understand how to use MetaboAnalyst, please follow the 11 protocols in this lab practical.
Data Input:
Critical: Before uploading your data, perform a sanity check:
- Verify that it is a data table separated by commas (.csv) or tabs (.txt);
- For concentration/peak intensity tables: three types of labels should be present; feature names, sample names and group labels (must directly follow sample names);
- All measurements should be numerical values (empty for missing values);
-
For details and screenshot instructions, click here
- Data 1 Metabolomic concentration table of 77 urine samples from cancer patients and healthy controls. Can be used for Protocols 1-5.
- Data 2 Peak intensity table of 48 fecal samples from pediatric inflammatory bowel disease patients and healthy controls. Can be used for Protocols 1-3.
- Data 3 Peak list of 48 fecal samples from pediatric inflammatory bowel disease patients and healthy controls. Used for Protocol 9.
- Data 4 Full peak intensity table of stool samples of CD (n = 266), UC (n = 144), and non-IBD (n = 135) obtained from Lloyd-Price et al.. Full metadata here. Can be used for Protocols 1-3.
Module 6: Future of Metabolomics
David Wishart
Access Module 6’s lecture here
Survey
please take 2min of your time Thank you here