Informatics and Statistics for Metabolomics 2020 Module 2 Lab
Module 2 Lab: Metabolite Identification and Annotation
In this lab, you will perform metabolite ID and/or quantification using NMR data and Bayesil; GC-MS data and GC-AutoFit; and spectral processing of untargeted LC-MS data and MetaboAnalyst/R.
NMR
Example Data
The sample data is from a study comparing healthy controls to endometrial cancer cases in females. The sample type is human serum. There are 40 samples total, 20 controls and 20 cases. The study population are female adults over the age of 18 with a mean age of 59.2 +/- 12.7 years for the controls and 59.1 +/- 12.8 years for the cases.
General Instructions
We will be using a special version of Bayesil for analysis of the NMR data. Please use server and login information assigned to you. A small NMR data set is available here. The .zip folder contains 2 spectra. Upload the dateset into Bayesil and run the server. Save the results as an Excel file. Examine the results by eye to find interesting differences. Use HMDB to learn about the interesting metabolites. In additional we included two larger dataset that could be optionally run after the lab. These datasets include a 8-spectra dataset and 40-spectra dataset, which was used to obtain the uploaded NMR result.
Bayesil
Bayesil is a web-based tool for automated NMR spectral profiling that is very accurate (95%) and which uses probabilistic graphical models (PGM). It fits shift and peak intensity similar to the way humans perform fitting and pattern finding. Bayesil requires priop knowledge of probable biofluid composition. It has fully automated phasing, referencing, water removal, baseline correction, identification, and quantification.
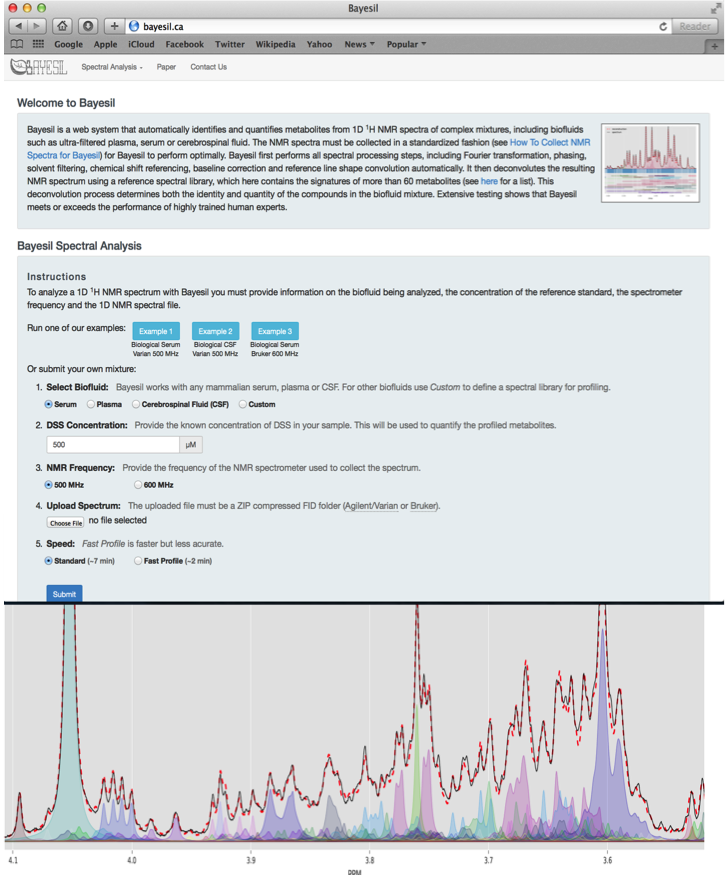
Bayesil Example Settings
| Biofluid | Serum |
| Chemical Shift (CS) Reference | DSS |
| CS Reference Concentration | 833 um |
| NMR Frequency | 500 MHz |
| Compressed FIDS | CBW_NMR_Set.zip |
| Speed | Standard |
Bayesil Batch Results
“In order to collect profiling results, you need to go to each individual spectrum, click on the download drop down menu (please see the snapshot below) and select the option “Quantitatives CSV”. You would need to combine them in a spreadsheet program (e.g. MS Excel) for further statistical analysis.”
Bayesil Spectrum Results

GC-MS
Example Data
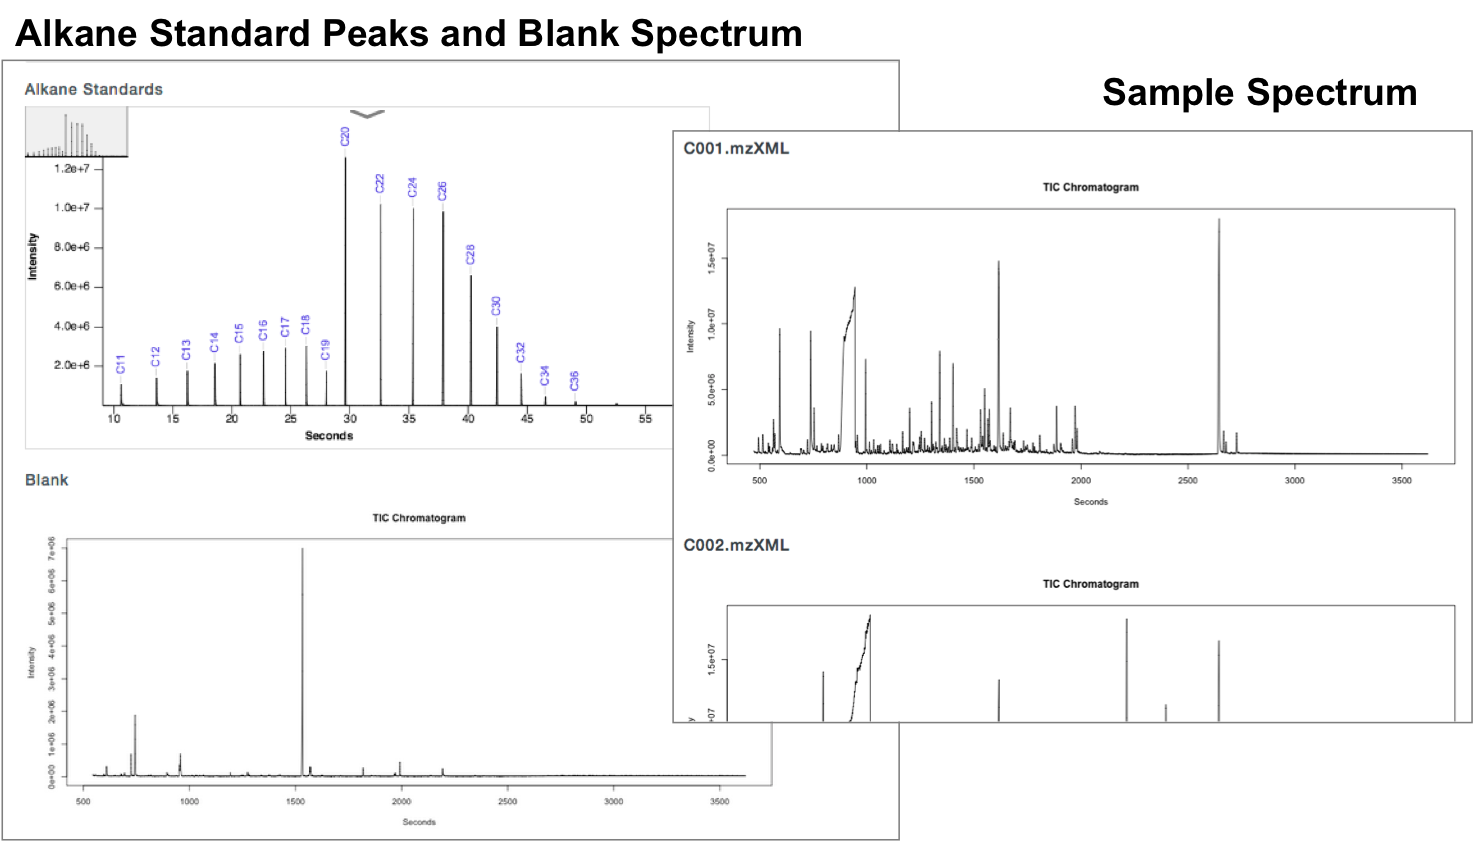
The sample data is from a study comparing 20 individuals with Eosinophilic Esophagitis (EoE) with 20 healthy controls, ages 3-13. The sample type is urine with an internal standard control of cholesterol. The example file contains one Alkane standard file, one blank file, and files for one sample from each group.
General Instructions
We will be using the special server of GC-AutoFit created for this workshop. Please use the server assigned to you for analysis of our data. The example data can be found here. Upload the files to GC-AutoFit and run the server. Save the results as an Excel file. Examine the results by eye to find interesting differences. Use HMDB to learn about the interesting metabolites.
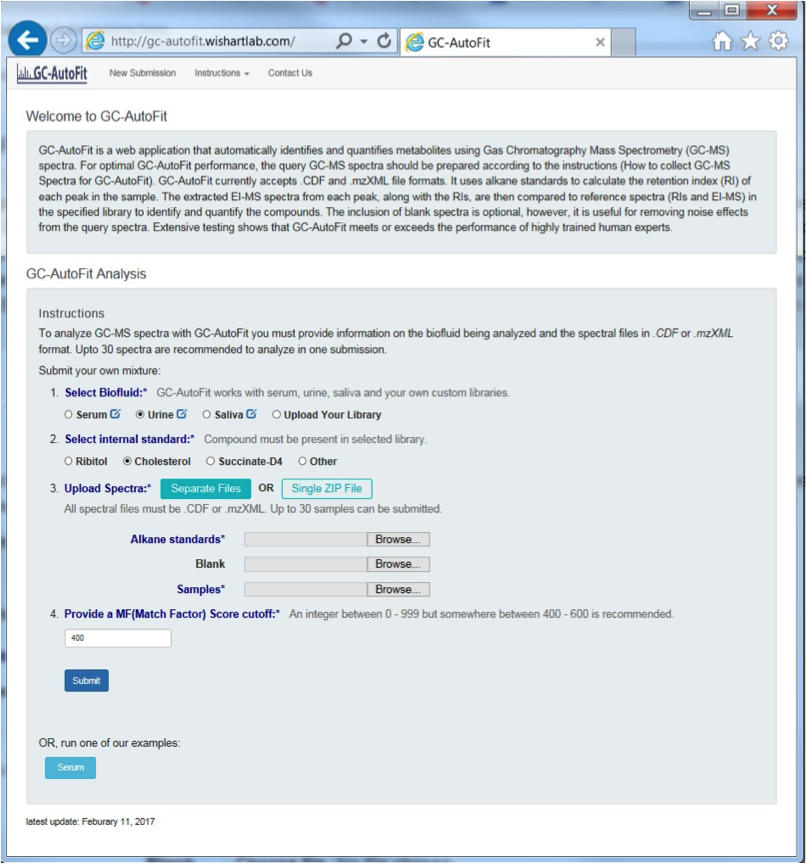
GC-AutoFit (Automated GC-MS)
GC-AutoFit website requires 3 spectra (sample, blank, and alkane standard). It performs auto-alignment, peak ID, peak integration, and concentration calculation. It accepts NetCDF and mzXML files. It takes 60 seconds per spectrum with 40-115 compounds ID’d at 96% accuracy. It is optimized for blood, urine, saliva, and cerbral spinal fluid. It still requires careful sample preparation and derivatization.
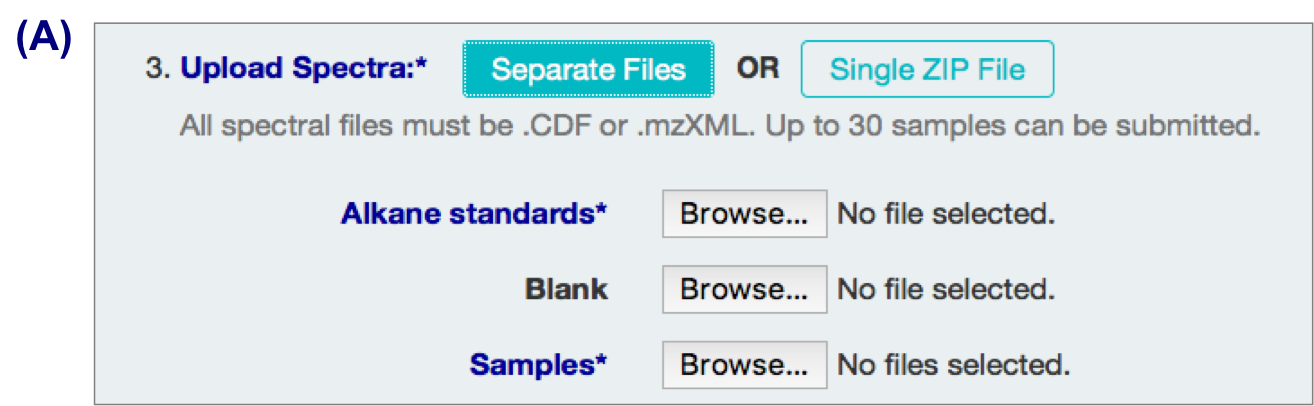
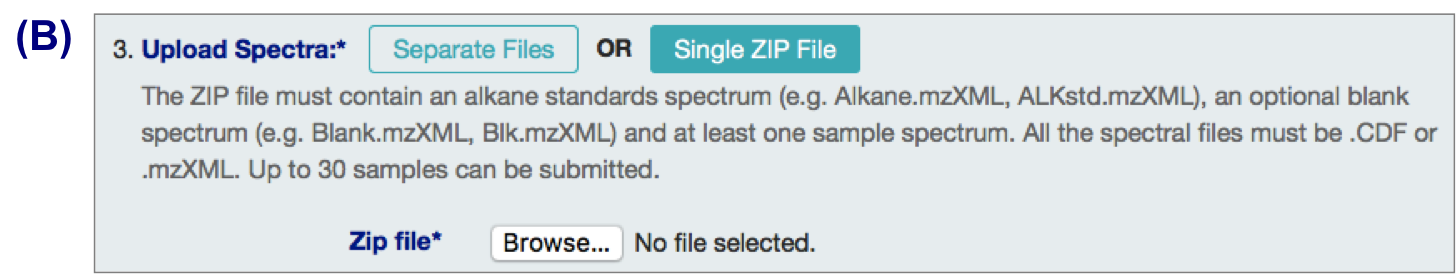
Preparing GC-MS Spectral Files
3 types of input files:
- alkane standard file (required; eg Alkane.mzXML, ALKstd.mzXML)
- a blank sample file (optional but recommended; eg Blank.mzXML, Blk.mzXML)
- Sample files (required)
Your files might require format conversion. Files are expected to be CDF or mzXML. “.D” format can be converted to “.CDF” or “.mzXML” format with conversion software such as ChemStation or ProteoWizard.
Uploading GC-MS Spectral Files
A. Individual files
B. .zip files
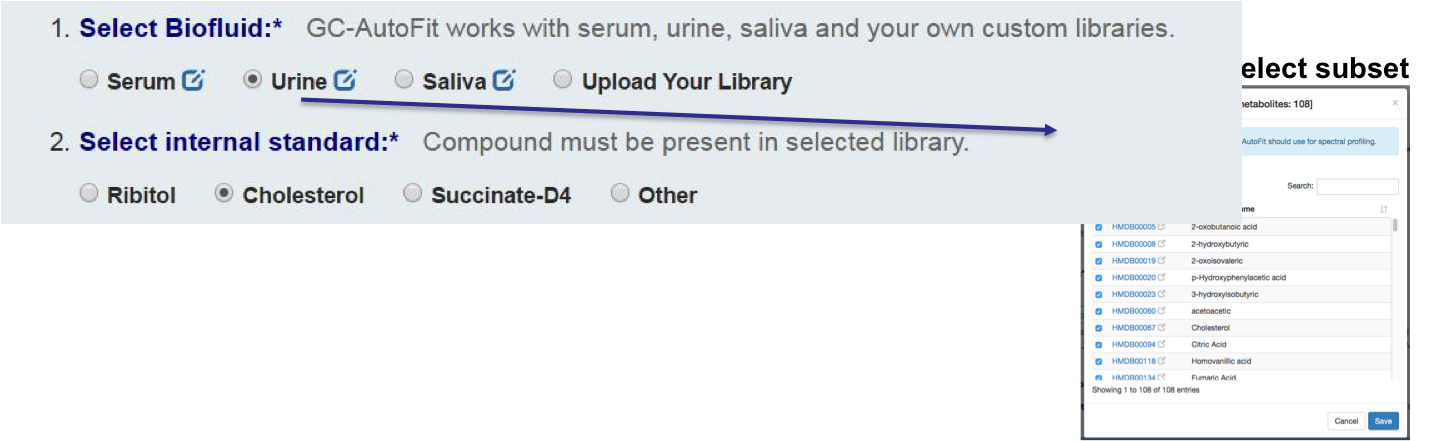
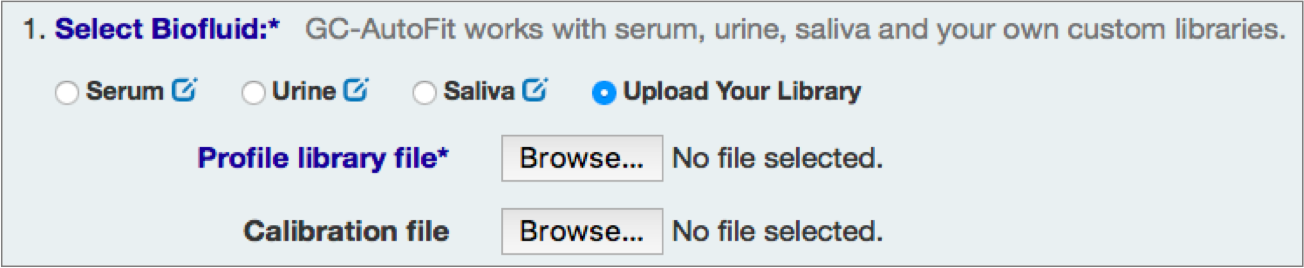
Select Sample Type and Library
You can either select an internal library (serum, urine/organic acids, saliva, etc) or a user library.
Set an internal standard for quantification:
or
Check Alkane Standard and Each Sample Spectrum
Profiling and Quantification
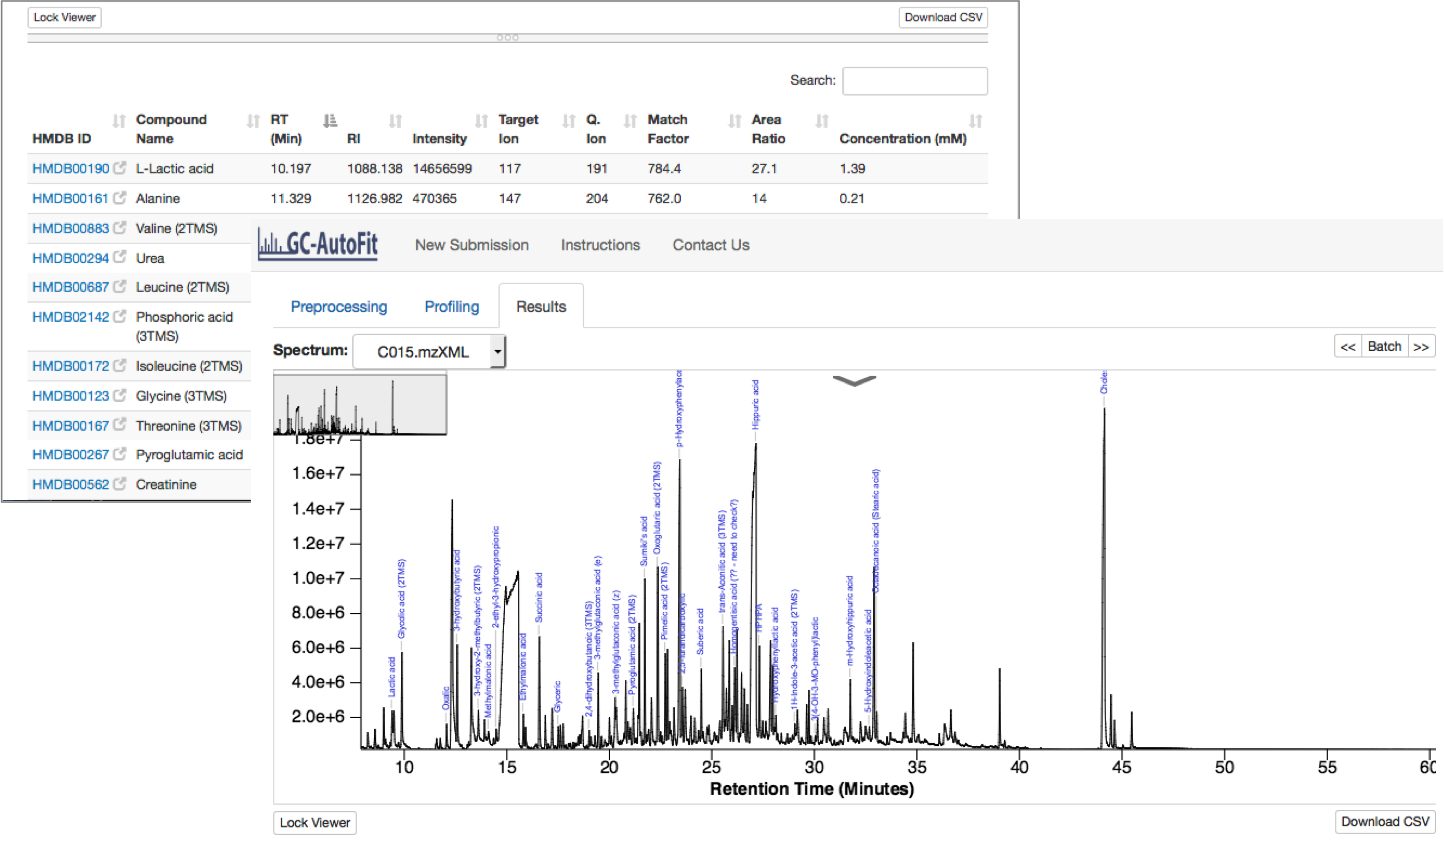
Final Results
Results are reported as a table (csv format) for each sample and merged concentrations for all samples.

LC-MS with MetaboAnalyst(R)

Example Data
This dataset was acquired using an UPLC-Q/E-ESI- in negative ionization mode. The 10 samples are a trimmed subset of a larger study from Lloyd-Price et al., and include fecal samples from people with Crohn’s Disease (CD, 4), healthy controls (4), and two quality controls. The metadata contains more sample information.
Example mzXML datasets (mzXML.zip files)
Spectra Processing with MetaboAnalyst (example result files)
Peak Table
Input for MS Peaks to Path
File conversion for vendor data
Use this tutorial to understand how to use msConvert to convert your data to open formats.
NOTE: Do this section only if you are comfortable using R
You will need to have R, MetaboAnalystR package dependencies, and MetaboAnalystR itself installed. You can optionally have ProteoWizard installed if your files are not in mzXML, mzML format (Windows only). All example data files are provided as mzXML converted files.
MetaboAnalystR
If you wish to use R instead of the MetaboAnalyst web-service for processing LC-MS spectra, please follow the MetaboAnalystR tutorial here.
Troubleshooting with Mac OS and MetaboAnalystR
In order to compile R for Mac OS, you need Xcode and GNU Fortran compiler installed (https://mac.r-project.org/tools/). MetaboAnalystR 3.0 also uses the Rccp R package as a dependency. Mac users may run into issues with getting this package installed. We suggest you follow these steps: https://thecoatlessprofessor.com/programming/cpp/r-compiler-tools-for-rcpp-on-macos/ to help with your installation.